Monthly Climate Summary: June 2026
Provided by the State Climate Office of Ohio, a collaboration of the Byrd Polar and Climate Research Center, Geography Department, and OSU Extension with support from Power A Clean Future Ohio

Subscribe to the Monthly Ohio Climate Summaries and Outlooks
Temperature
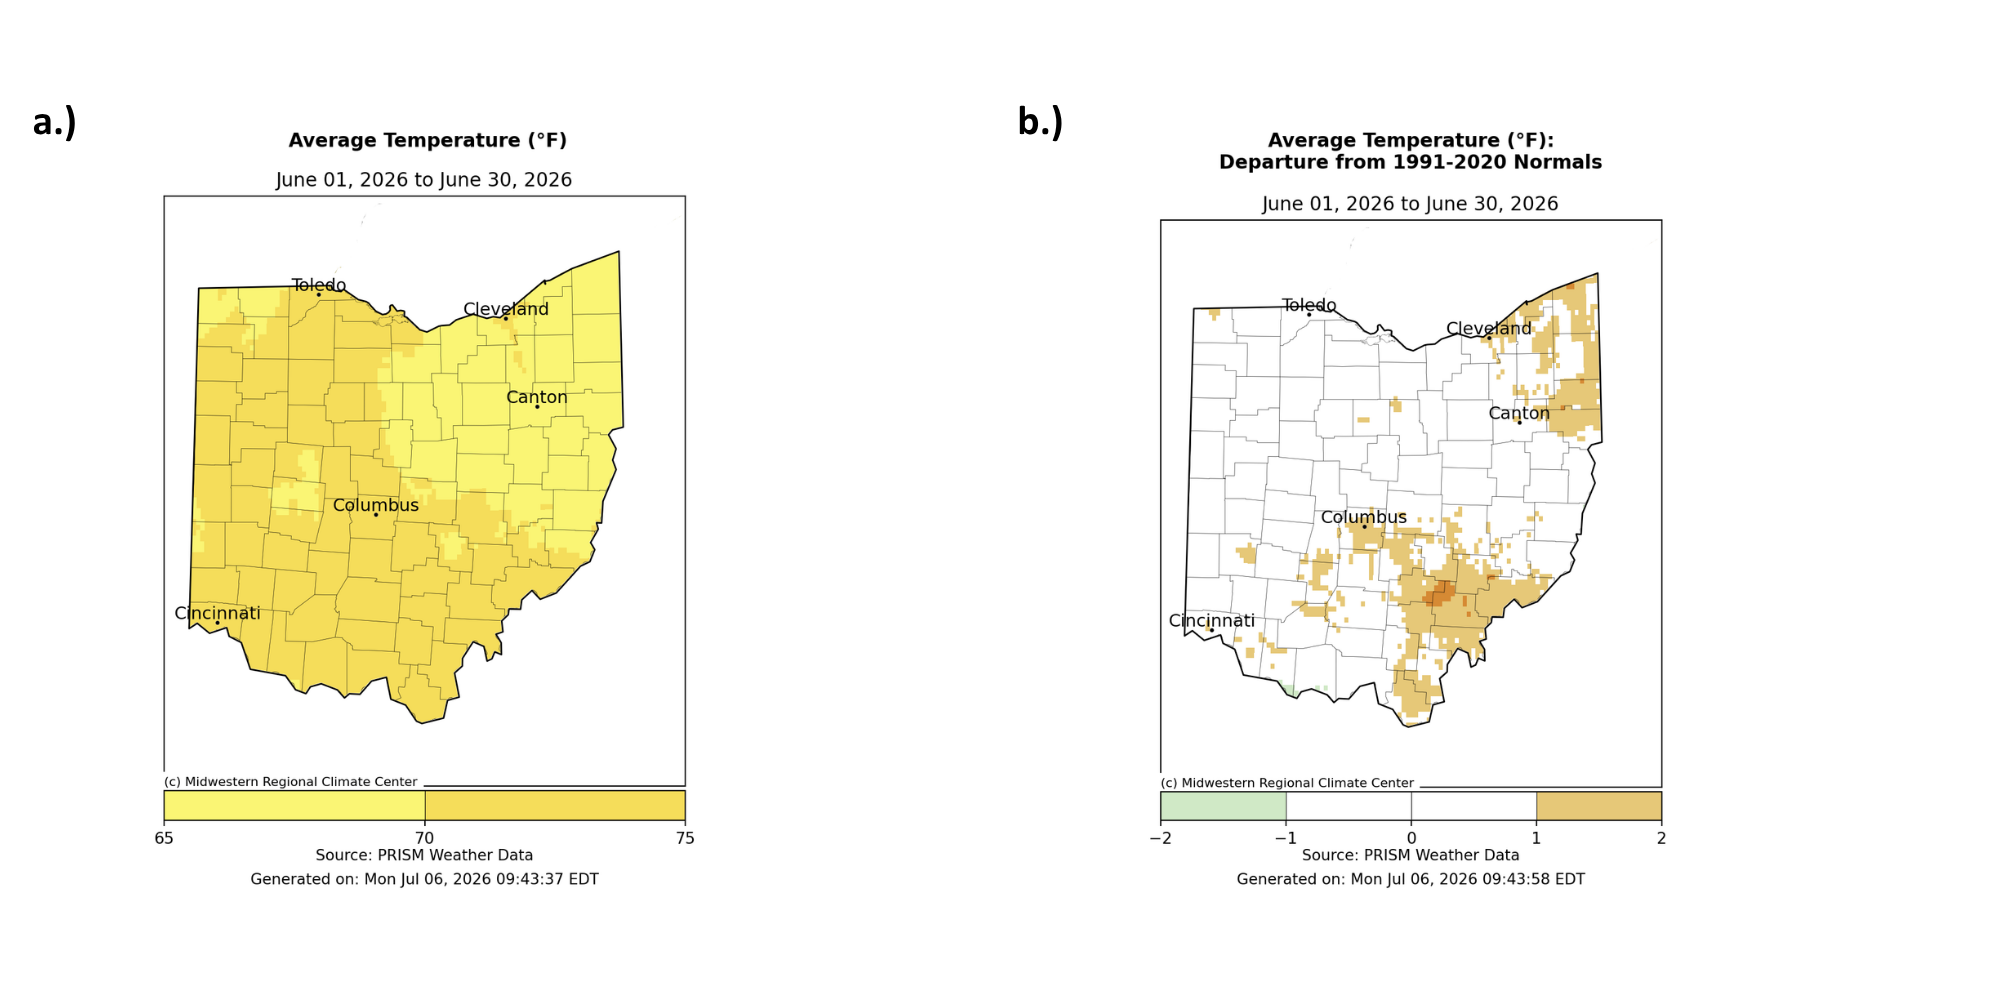
June remained relatively calm across Ohio, with temperatures varying by only about 10 degrees statewide and staying near normal for most regions. Average temperatures ranged from 65– 70°F in northeast and parts of central Ohio, while the rest of the state held between 70–75°F (Fig. 1a). Compared with June climatological normals, most areas were close to average, though northeast and southeast Ohio ran about 1–2°F warmer than normal (Fig. 1b).
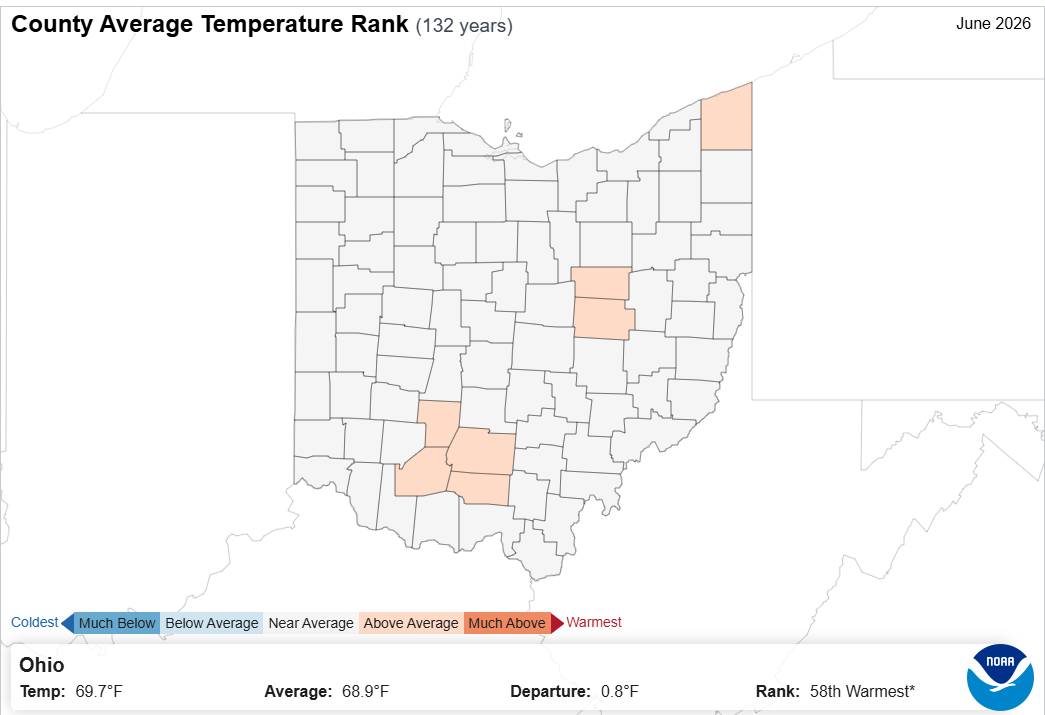
This June marked Ohio’s 58th-warmest on record, with a statewide average temperature of 68.9°F. Nearly every county finished near its typical June temperature, with only seven counties running slightly above average. These warmer counties were dispersed across the state without any distinct regional pattern (Fig. 2).
Precipitation
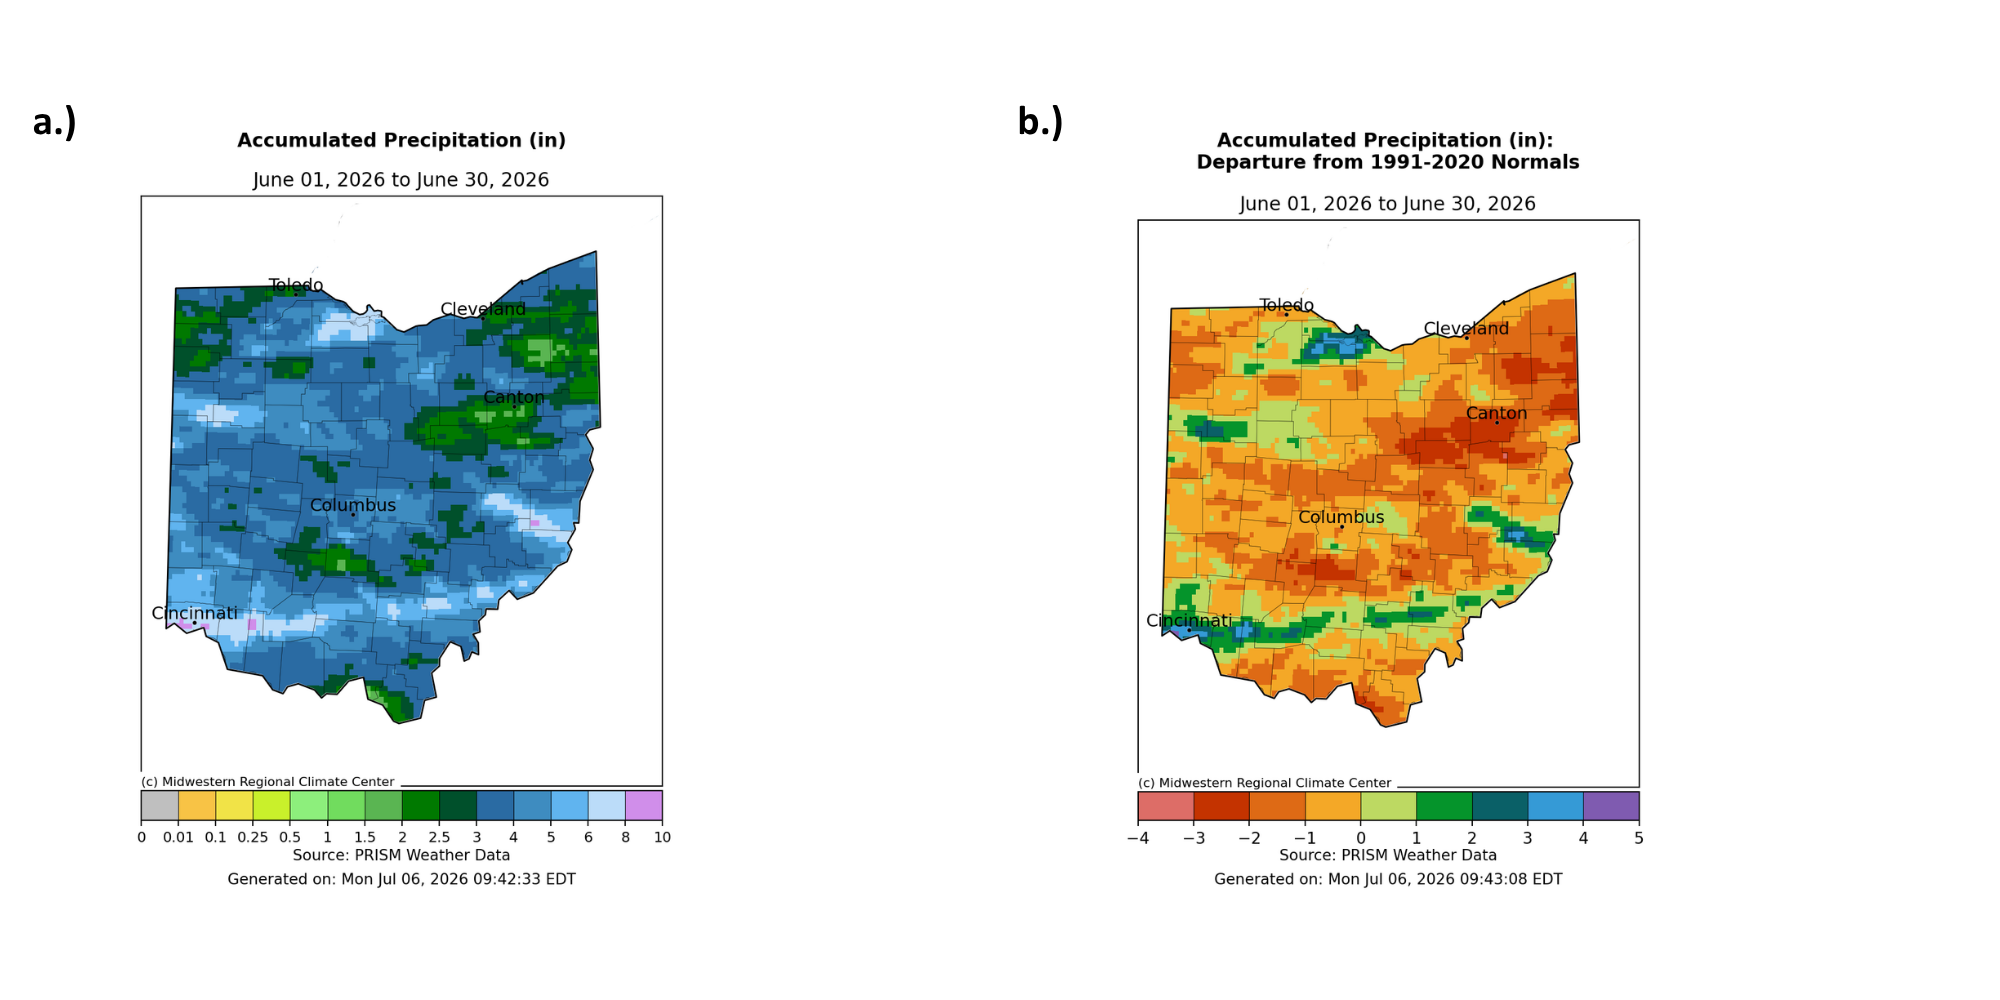
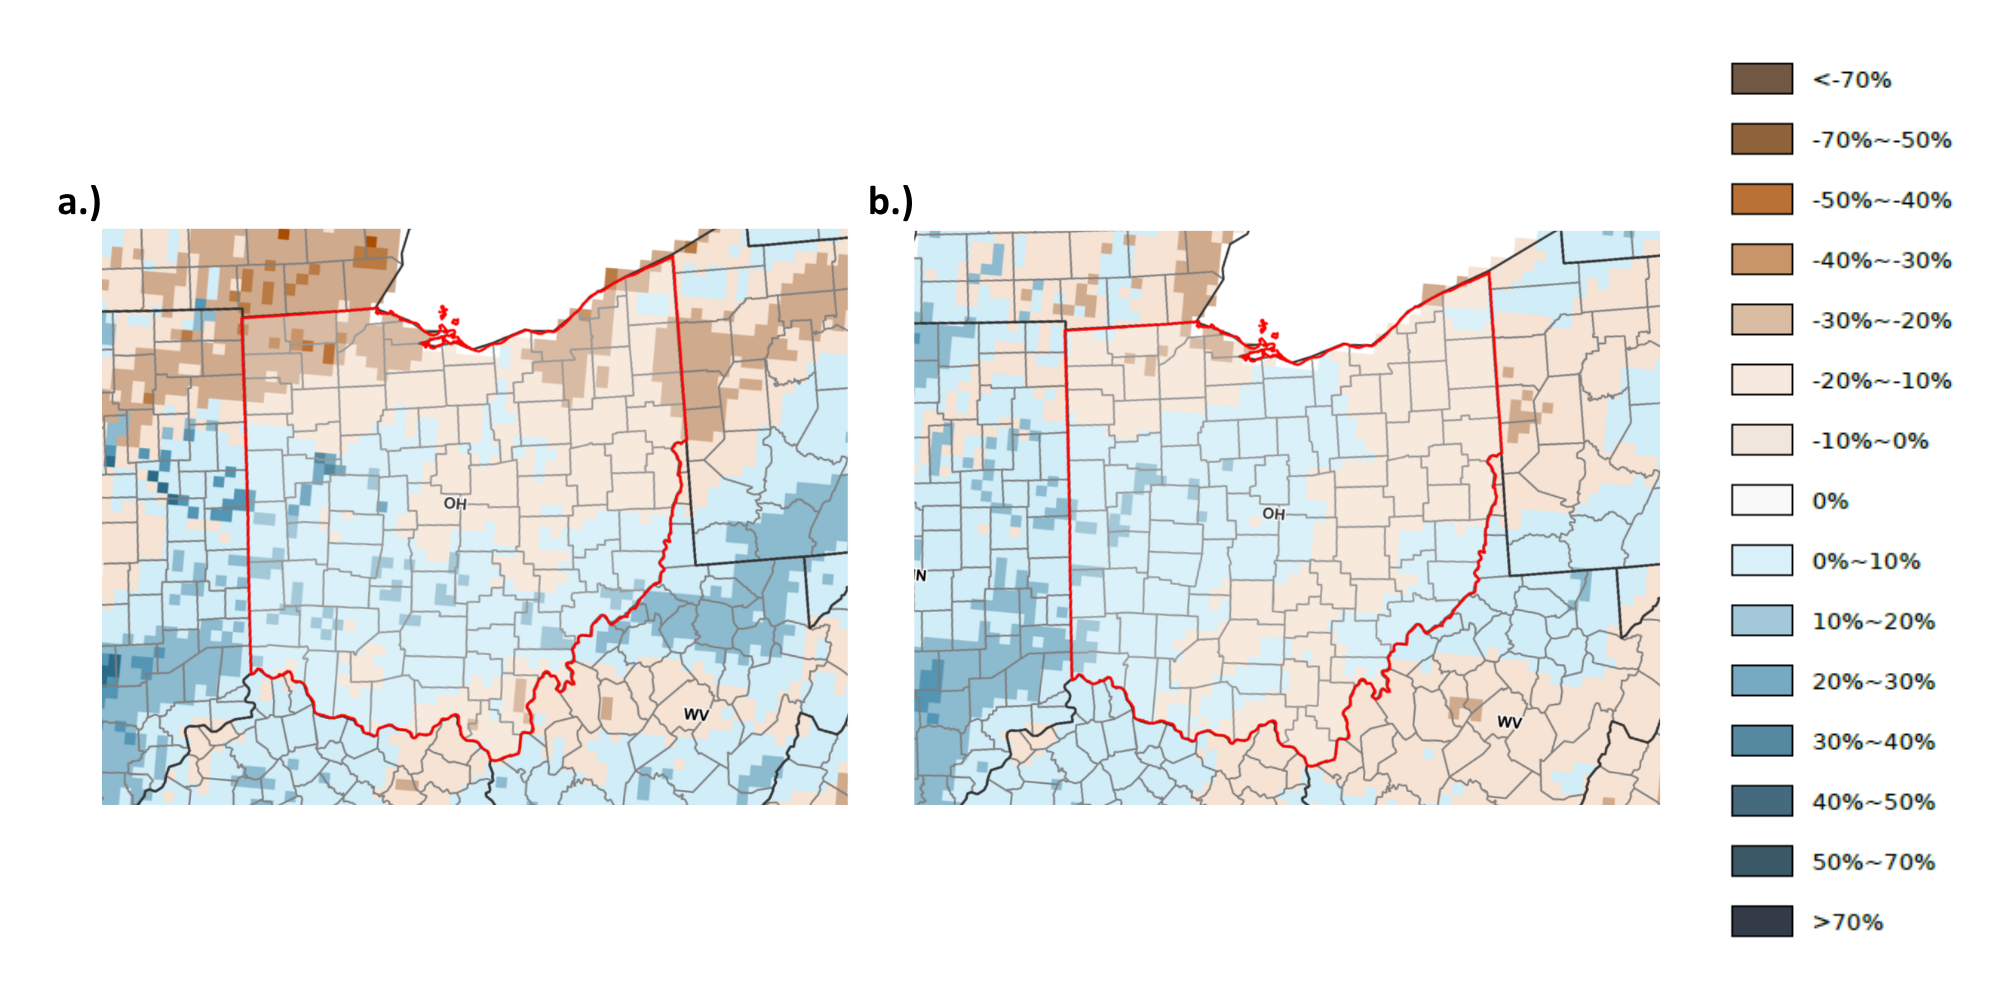
June precipitation was sufficient to keep Ohio drought-free throughout the month. Most areas received at least 1.5–2 inches of rainfall, while south and east-central Ohio saw significantly higher totals of 8–10 inches. Northeast, northwest, and central Ohio recorded the lowest amounts, ranging from 1.5–3 inches (Fig. 3a). Relative to June normals, precipitation was near average across much of the state, with northeast and central Ohio running 2–3 inches below normal and southern, northern, and northeastern Ohio exceeding normal by 3–4 inches (Fig. 3b).
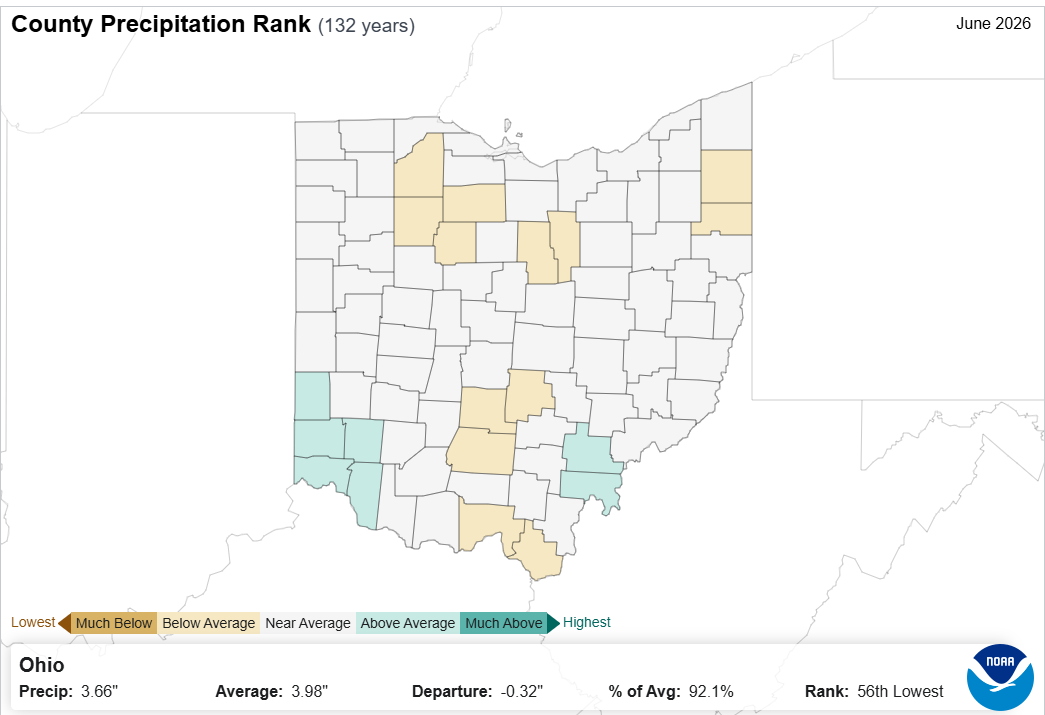
With such a wide range of precipitation totals across the state, the county-level precipitation rankings reflect this variability. Below-average precipitation shows no clear spatial pattern, while most counties with above-average totals are concentrated in the south (Fig. 4). Overall, June ranked as the 56th-driest on record, with a statewide average of 3.96 inches.
Soil & Energy
Entering the warmer months, indications of declining soil moisture suggest that drought could develop in more sensitive areas. Although no region surpassed the 50% threshold for below- or above-average soil moisture at the end of June, northeast and northwest Ohio show the greatest concern, with topsoil moisture running 20–30% below normal and localized deficits reaching 40– 50% (Fig. 5a). Continued drying at the surface may propagate downward, affecting subsoil conditions through July. Conversely, central and southern Ohio remain near normal, with isolated areas reporting 10–20% above-normal moisture in both topsoil and subsoil (Fig. 5b).
Product Note: Both NASA SPoRT LIS soil moisture products contain small pockets of inaccurate data indicating extremely wet or dry conditions. These small-scale errors can emerge in remote sensing products covering large areas or grid-spacings. For more information, please contact Geddy Davis (davis.5694@osu.edu).
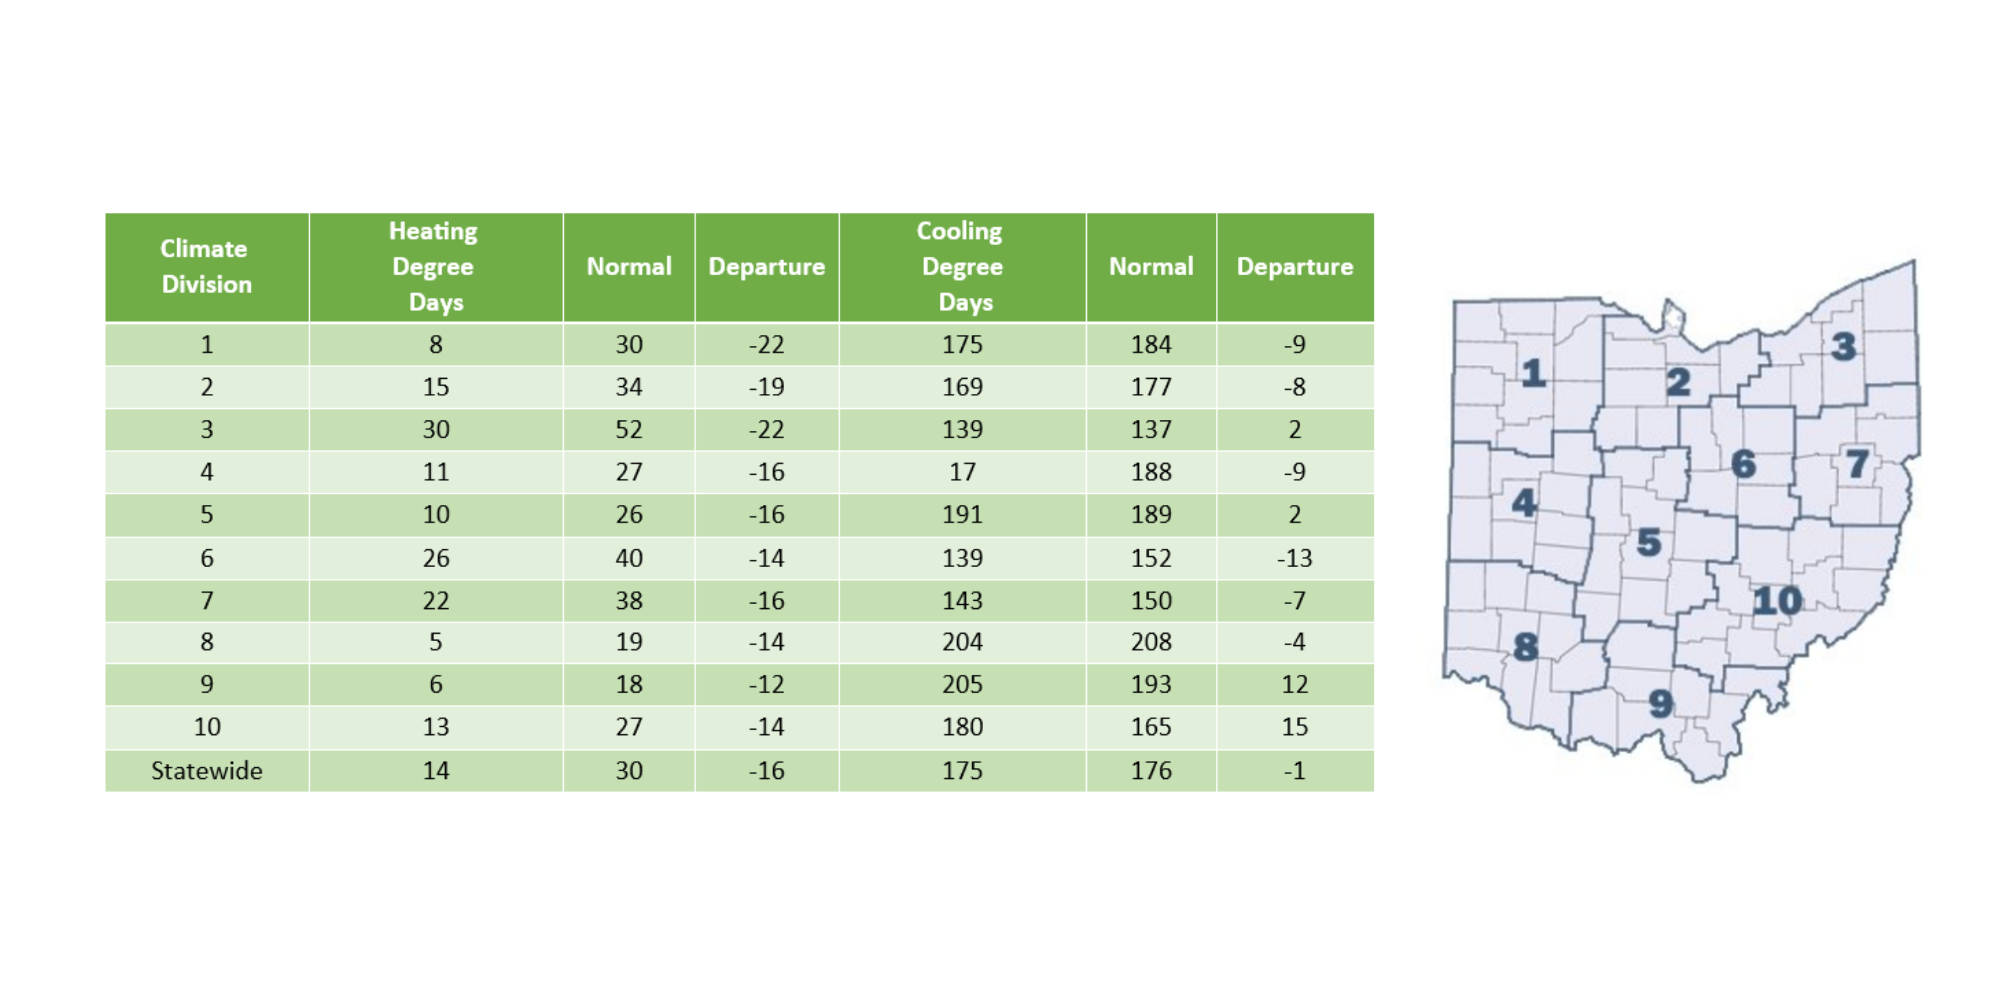
Heating Degree Days (HDDs) and Cooling Degree Days (CDDs) were both lower than normal, resulting in reduced statewide temperature-control demand. HDDs averaged −16, and CDDs averaged −1 (Fig. 6).
Notable Event
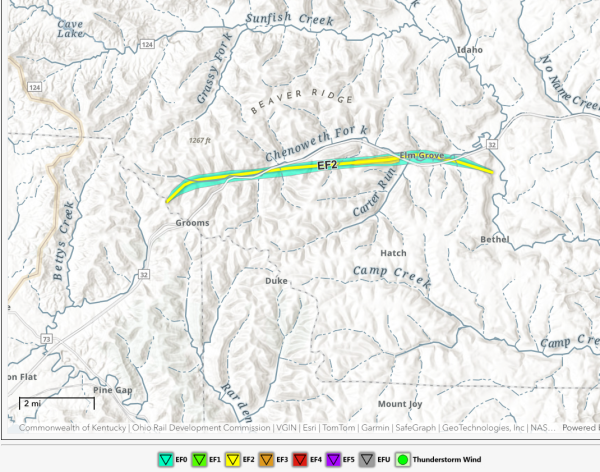
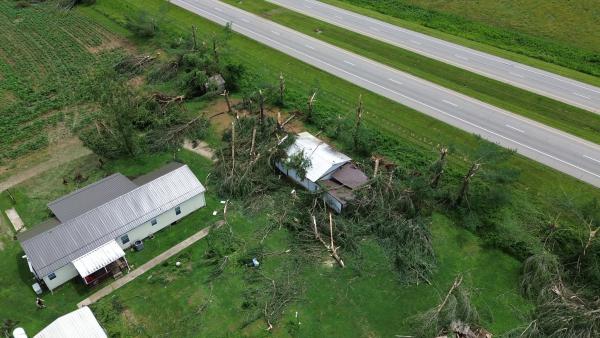
As tornado season draws to a close, June produced Ohio’s most significant tornado of the year. The storm system, which first developed in Illinois, swept through the Ohio Valley and generated seven tornadoes: four EF2s and three EF1s. Only one touched down in Ohio: an EF2 in Pike County that caused substantial damage to homes and vegetation. At 4:05 a.m. on June 18, the tornado began its nearly nine-mile trek across the hills of Elm Grove, reaching maximum winds of 115 mph (Fig. 7).
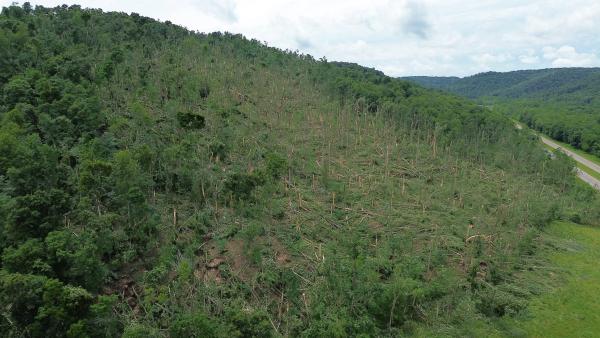
In just 15 minutes, a hillside once thick with trees was transformed into a landscape of scattered debris (Fig. 8).
Thankfully, the region is not densely populated, and no fatalities occurred, though several homes and barns were left beyond repair as roofs were lifted off and structures torn apart (Fig. 9).
What made this severe weather event particularly dangerous was its timing. By the time the tornado passed through, most people were asleep, and without audible alerts from mobile devices, they would have had no way of knowing what was coming. Ohio sees frequent summertime storms, especially later in the day, so staying weather-aware and preparing ahead of time is the best way to stay safe. Building an emergency kit, knowing where to go during severe weather, and keeping up with local forecasts can help ensure severe weather is far less frightening.
Looking Ahead
Seasonal projections for July, August, and September show no dominant climate signal, leaving the summer outlook largely undetermined. Ohio is positioned in an equal-chance category for both temperature and precipitation, indicating that above-, near-, and below-normal outcomes are all equally plausible (Fig. 9a, 9b).
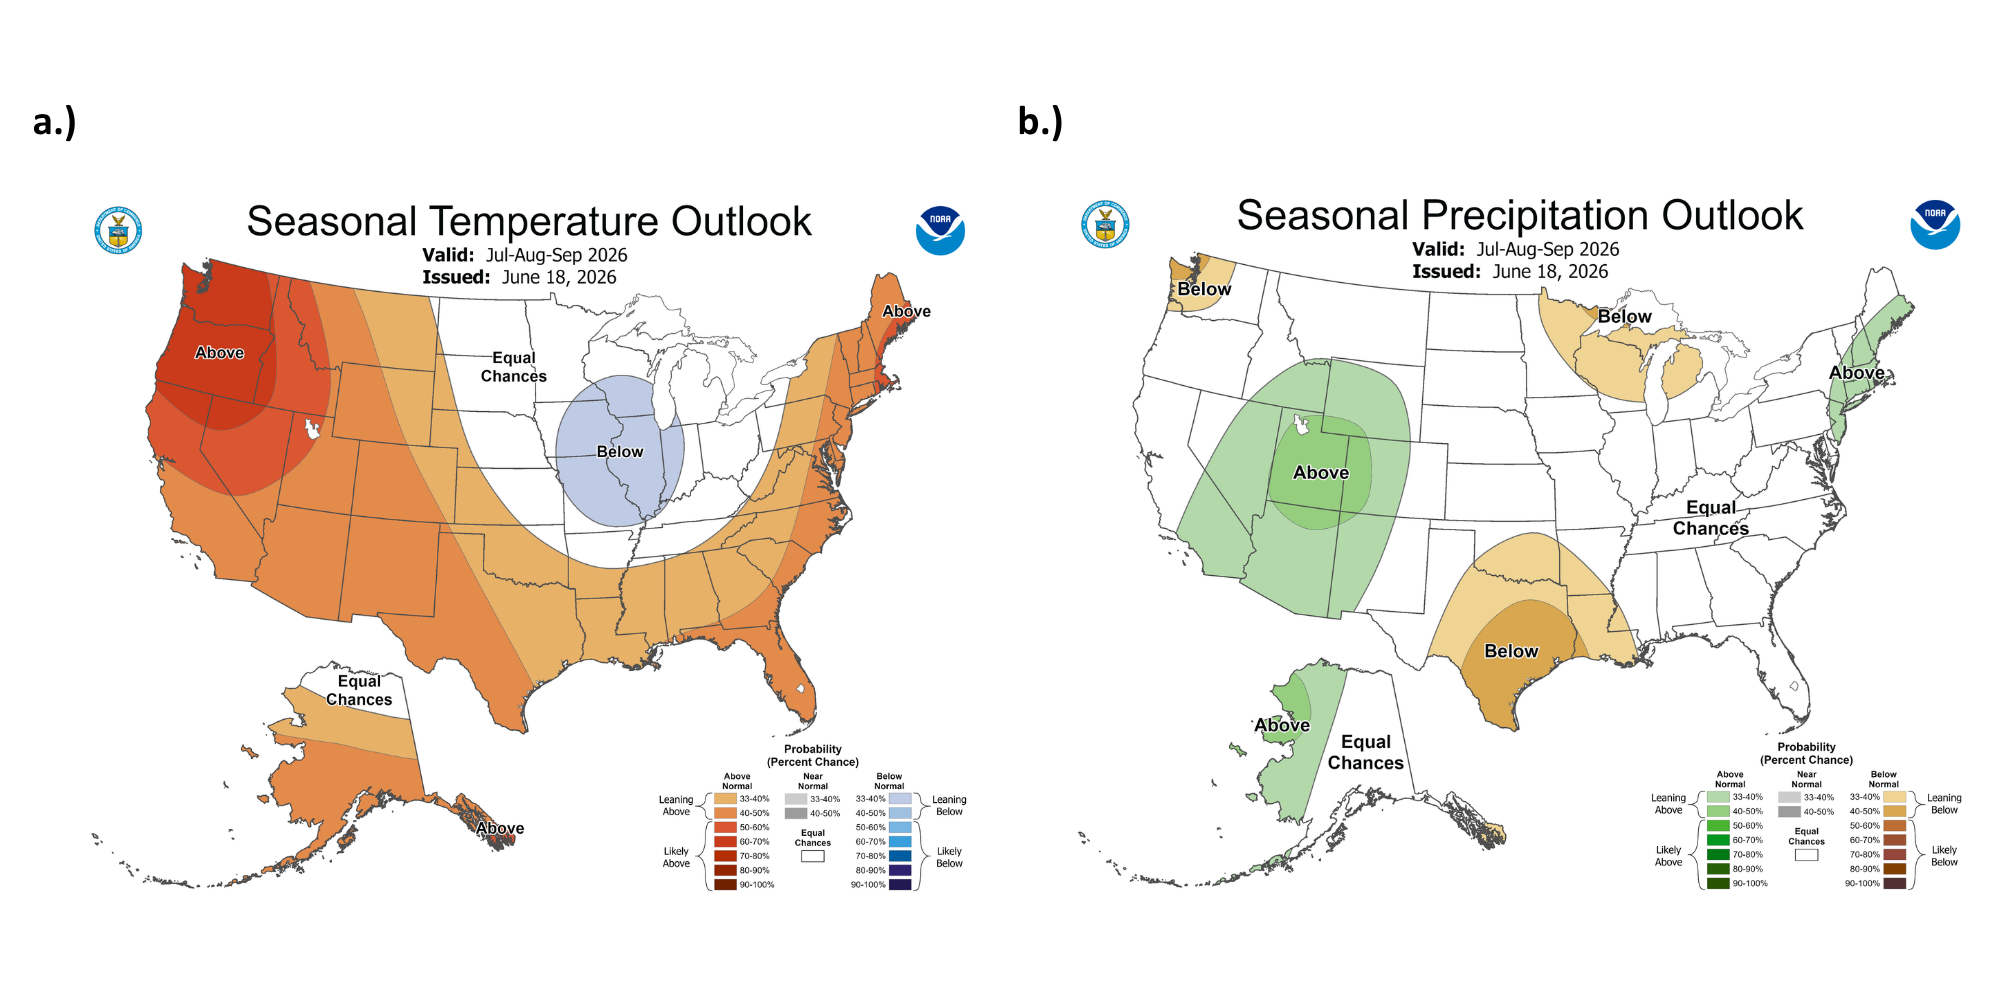
This summer has been particularly challenging to forecast, with temperature and precipitation patterns shifting from week to week. Summer rainfall already tends to vary widely, and recent weather has reinforced this—localized strong thunderstorms, heavy downpours, and sharp gradients in precipitation. This looks to continue into the coming weeks. Meanwhile, the late-June heat wave was quickly followed by a brief “cooling” period that offered some relief. This continued oscillation between hot and warm conditions is expected to persist through July and helps explain why seasonal outlooks have consistently placed Ohio in the equal-chance category. Note: these outlooks do not provide the quantity of above- or below-normal conditions,just the likelihood of occurrence (i.e., the probability).
Authors
Alexis Jahnke: Undergraduate Student, Student Assistant: Climate Services, Byrd Polar and Climate Research Center, The Ohio State University, jahnke.30@osu.edu
Geddy R. Davis: Meteorologist/Atmospheric Scientist, Program Coordinator: Climate Services - Byrd Polar and Climate Research Center, The Ohio State University, davis.5694@osu.edu
Aaron B. Wilson: State Climate Office of Ohio, Byrd Polar and Climate Research Center & OSU Extension, The Ohio State University, wilson.1010@osu.edu