Provided by the State Climate Office of Ohio, a collaboration of the Byrd Polar and Climate Research Center, Geography Department, and OSU Extension with support from Energent Solutions.
Subscribe to the Monthly Ohio Climate Summaries and Outlooks
Temperature
Although October ended with fall-like conditions, a warmer start to the month led to generally warmer-than-average temperatures ranging from 50-60°F. While there wasn’t a strong gradient, a subtle west-to-east divide was evident, with averages ranging from 55–60°F in the western half of the state and 50–55°F in the east (Fig. 1a). When compared to the departure from normal, most of Ohio experienced above-normal temperatures, except for areas southeast of Cleveland and localized regions south of Columbus that remained near average for the month. The above-normal areas saw temperature increases of roughly 1–4°F, with the strongest anomalies occurring west of Toledo (Fig. 1b).
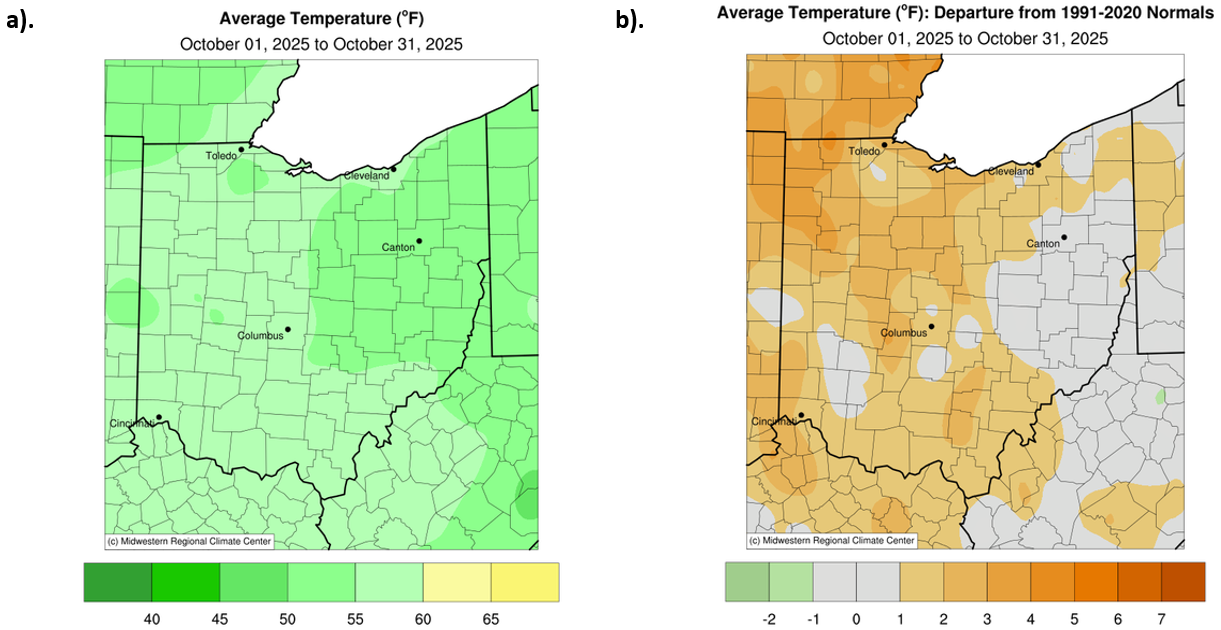
Product Note: All NCEI county-level data were not released due to the ongoing federal government shutdown. Because the monthly summaries rely on NCEI county-level temperature and precipitation rankings, these datasets will be excluded from the summaries until the data become available again.
Precipitation
Total accumulated precipitation across Ohio ranged from 0.5 to over 8 inches during October. The driest areas were located in northwest Ohio, receiving between 0.5 and 1 inch of rainfall, while the wettest areas were found northeast of Cleveland, where totals reached 6 to over 8 inches. Most of the state received at least 2 inches of precipitation (Fig. 3a). When compared to the departure from normal, much of Ohio experienced near- to above-normal precipitation. In particular, Northeast and Southwest Ohio were 2-5 inches above normal in accumulated precipitation. However, localized deficits of 1 to 2 inches were observed in northwest Ohio, as well as east of Columbus and near the southern tip of the state (Fig. 3b).
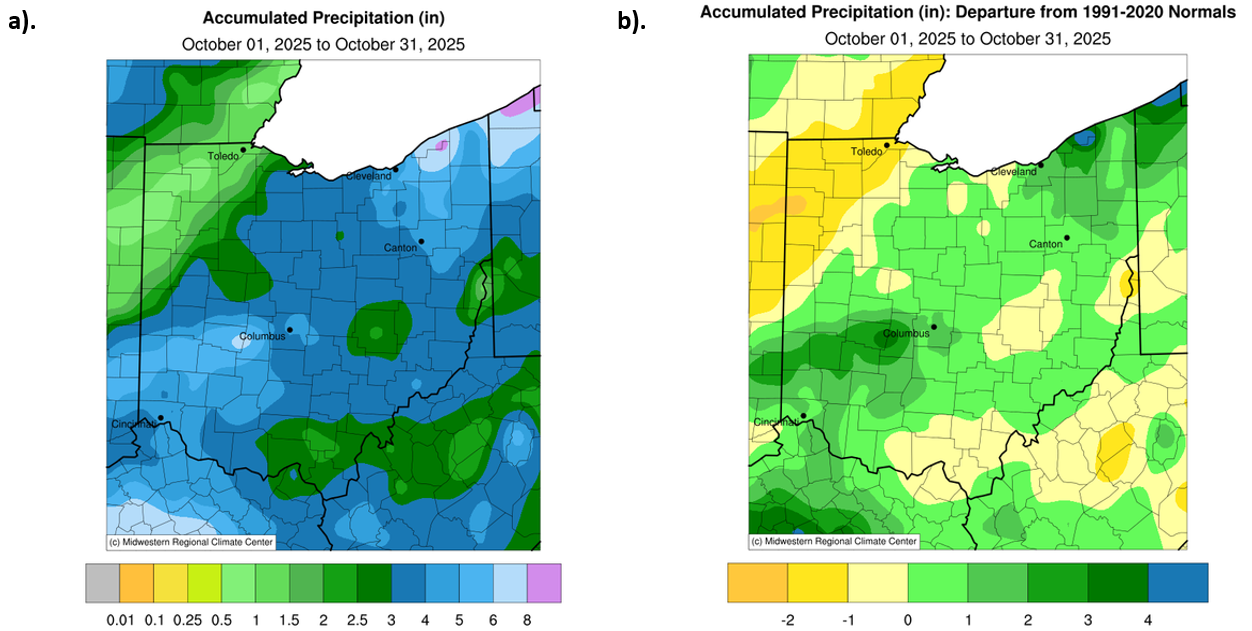
Product Note: All NCEI county-level data were not released due to the ongoing federal government shutdown. Because the monthly summaries rely on NCEI county-level temperature and precipitation rankings, these datasets will be excluded from the summaries until the data become available again.
Soil & Energy
Soil moisture from 0 to 40 centimeters deep leaves Ohio split into an eastern and western portion of the state at the end of October. The wettest soils are northeast and are ranked from the 70th to 100th percentile. The driest soils are in northwest Ohio and are in the 2nd percentile. The divide between these two polarizing regions is near normal throughout central Ohio (Fig. 5a). Transitioning to a deeper depth, 0 to 200 cm, most of Ohio ranks anywhere between the 30th to 2nd percentile, indicating dry soils. Again, northwest Ohio is hit hard with having the driest soils out of Ohio (Fig. 5b).
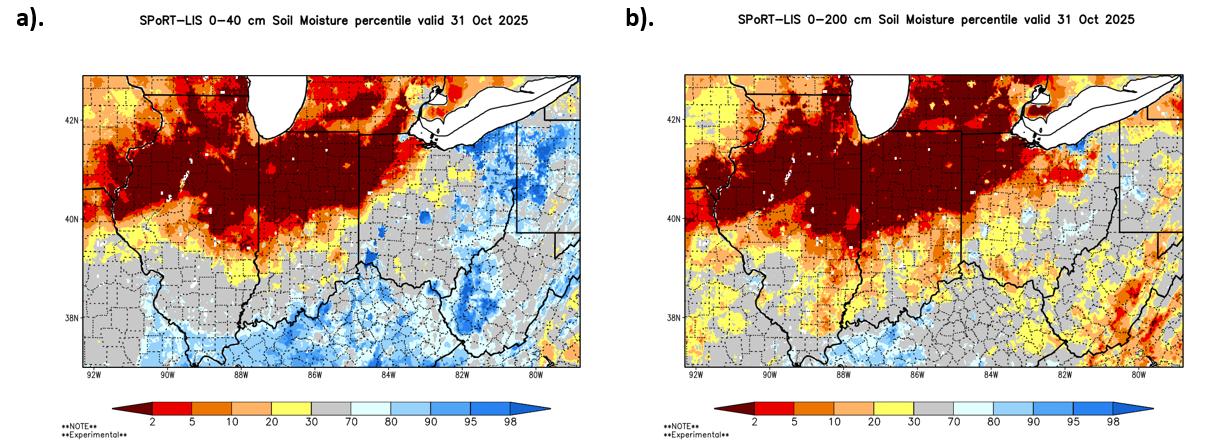
Product Note: Both NASA SPoRT LIS soil moisture products contain small pockets of inaccurate data indicating extremely wet or dry conditions. These small-scale errors can emerge in remote sensing products covering large areas or grid-spacings. For more information, please contact Geddy Davis (davis.5694@osu.edu).
The Midwestern Region Climate Center (MRCC) recorded Heating Degree Days (HDDs) as below average for the month of October (Fig. 6). This is consistent with the warmer temperatures experienced at the beginning of the month, which reduced the energy demand for heat.
At this time, the Cooling Degree Days are unavailable for October through the MRCC.

Notable Events
October 7th brought record-breaking daily rainfall in parts of Central and Southwest Ohio. More specifically, Columbus broke its daily rainfall record on this day when the city received 1.84 inches of rain. This broke the previous record set in 1998, when 1.61 inches of rain fell. This rain event was one of the first after a prolonged dry spell had cast a shadow over Ohio, causing an extreme drought. On the same day, our South Charleston Mesonet station recorded over 4.10 inches of rain in 24 hours. One component of our complete weather station setup is a rain gauge, which allows data to be recorded and collected in instances like this one, where a significant amount of rainfall occurs in a short period of time (Fig. 7).
Drought
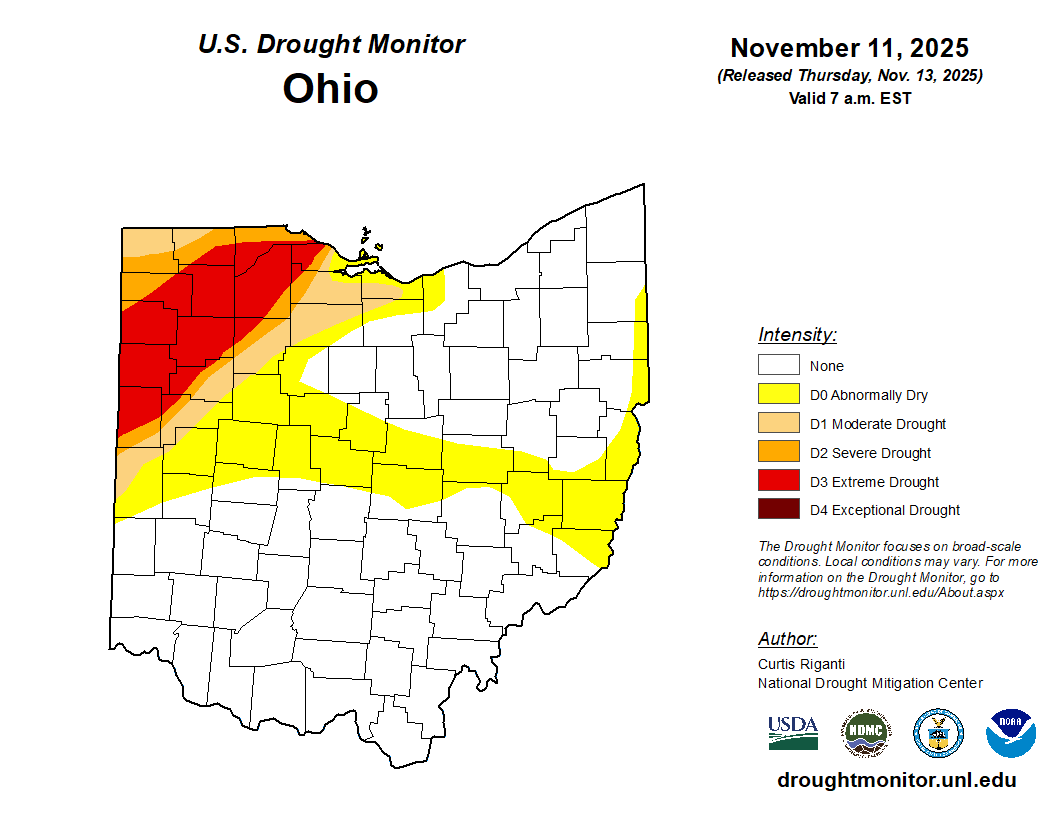
Even with recent significant rainfall in areas such as Columbus and South Charleston, northwest Ohio continues to experience D3 (extreme drought) conditions. A gradient of dryness extends from there into North Central and Eastern Ohio (Fig. 8). Currently, an estimated 1,221,389 people across the state are affected by drought. According to the latest U.S. Drought Monitor, conditions have shown slight improvement compared to last week. When compared to this time last year, drought conditions are much more localized and extreme in Northwest Ohio, while the rest of the state is in an overall better condition. As the harvest season comes to an end, the focus shifts from crop health to concerns about soil moisture for next year’s planting. Prolonged drought can also lower water levels in streams, lakes, and rivers, posing broader challenges for Ohio’s overall water supply.
Looking Ahead
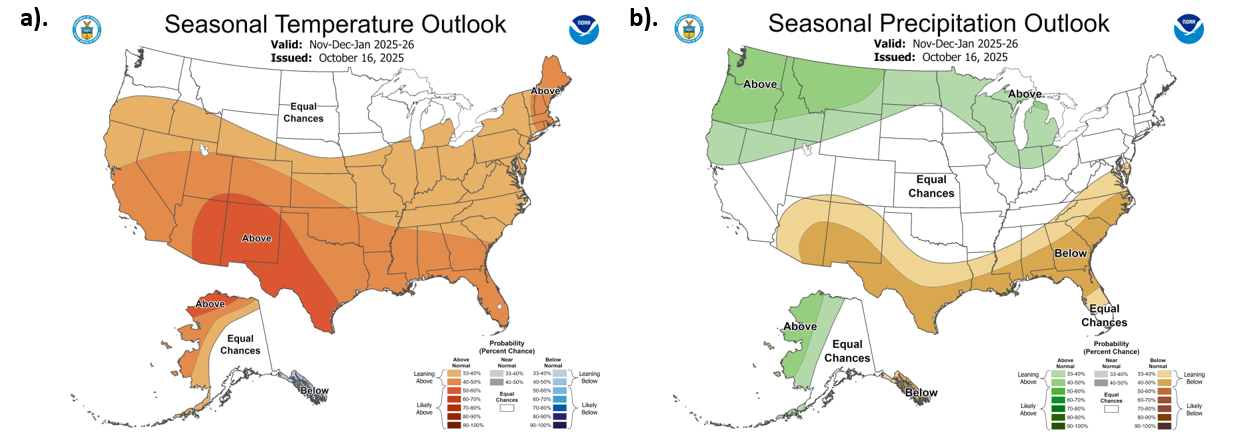
For the next three months, the Climate Prediction Center outlook indicates that Ohio is leaning toward warmer-than-normal temperatures. There is also a chance for above-normal precipitation across northwest Ohio. Statewide, temperatures have a 33–40% probability of being above normal (Fig. 9a). Precipitation patterns, however, are more varied. Northwest Ohio shows a 33–40% chance of above-normal precipitation, while the rest of the state has equal chances for above- or below-normal conditions (Fig. 9b). This outlook is encouraging for Northwest Ohio, as it is the region being most impacted by ongoing drought conditions.
With winter fast approaching, farmers are working to winterize their fields in preparation for the colder months. Tilling and planting cover crops are in full swing to help preserve soil nutrients. However, with the potential for variable weather patterns in the upcoming months, this uncertainty could limit farmers’ ability to complete these tasks before winter fully sets in.
Note: these outlooks do not provide the quantity of above or below normal conditions, just the likelihood of occurrence (i.e., the probability).
Authors
Alexis Jahnke: Undergraduate Student, Student Assistant: Climate Services, Byrd Polar and Climate Research Center, The Ohio State University, jahnke.30@osu.edu
Aiden Ridgway: Undergraduate Student, Student Assistant: Climate Services, Byrd Polar and Climate Research Center, The Ohio State University, ridgway.72@osu.edu
Geddy R. Davis: Meteorologist/Atmospheric Scientist, Program Coordinator: Climate Services - Byrd Polar and Climate Research Center, The Ohio State University, davis.5694@osu.edu
Aaron B. Wilson: State Climate Office of Ohio, Byrd Polar and Climate Research Center & OSU Extension, The Ohio State University, wilson.1010@osu.edu
