Monthly Climate Summary: January 2026
Provided by the State Climate Office of Ohio, a collaboration of the Byrd Polar and Climate Research Center, Geography Department, and OSU Extension with support from Energent Solutions.
Subscribe to the Monthly Ohio Climate Summaries and Outlooks
Temperature
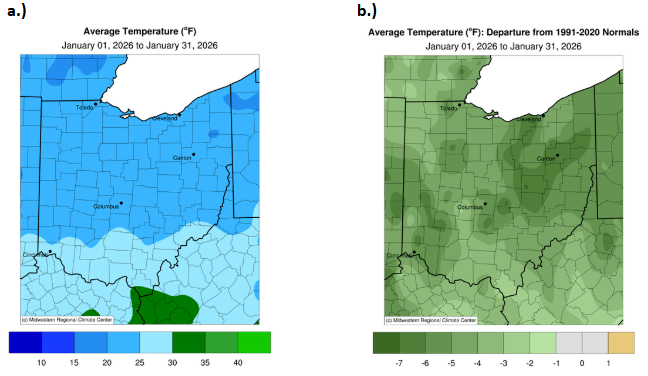
Most of Ohio experienced average January temperatures below 30°F. Much of the state, from northern Ohio through areas south of central Ohio, saw temperatures ranging from 20 to 25°F. Farther south, average temperatures gradually increased to between 25 and 30°F. The southernmost regions of Ohio were the warmest, with average January temperatures ranging from 30 to 35°F (Fig. 1a). Compared to historical averages, all of Ohio experienced colder-than-normal temperatures in January. No single, consistent spatial pattern emerged across the state, resulting in varied temperature departures. The largest negative anomalies, up to 6°F below normal, occurred in parts of northeastern and central Ohio. In contrast, the southernmost region of the state remained closest to normal, with temperatures only about 1°F below average. (Fig. 1b).
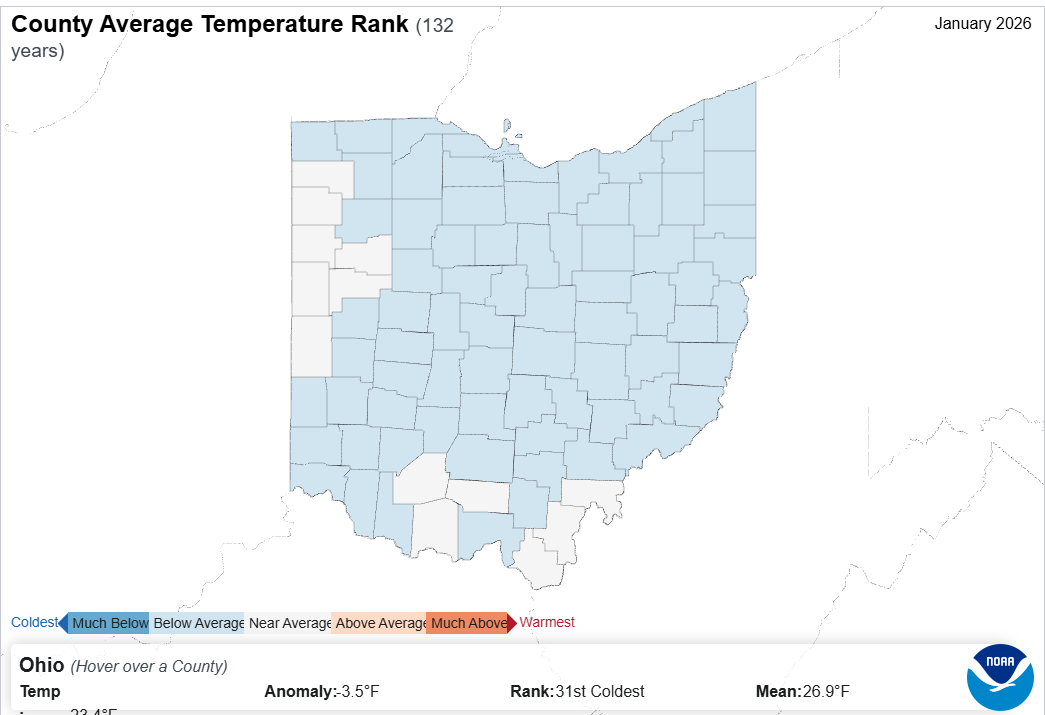
Breaking down the state’s average temperatures further, the majority of Ohio counties experienced below-average conditions in January. However, parts of southern and northwestern Ohio remained closer to near-average temperatures (Fig. 2). Historically, this January was the 31st coldest in 132 years, with a mean temperature of 26.9°F.
Precipitation
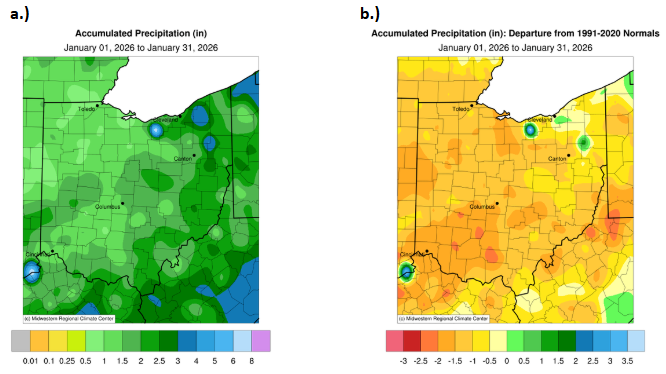
Despite a winter storm impacting the central United States, Ohio’s total January precipitation remained on the lower end overall. The highest precipitation totals, up to 4 inches, occurred east and southeast of Cleveland. In contrast, northwestern Ohio and areas south of central Ohio recorded only 0.5 to 1.5 inches of precipitation (Fig. 3a). Relative to historical averages, this January was drier than normal across nearly the entire state. A small region east of Cleveland was the lone exception, receiving about 0.5 inches more precipitation than average. Elsewhere, most of Ohio experienced precipitation deficits of 1 to 1.5 inches, with the largest shortfall occurring in southwestern Ohio, where totals were up to 2.5 inches below normal (Fig. 3b).
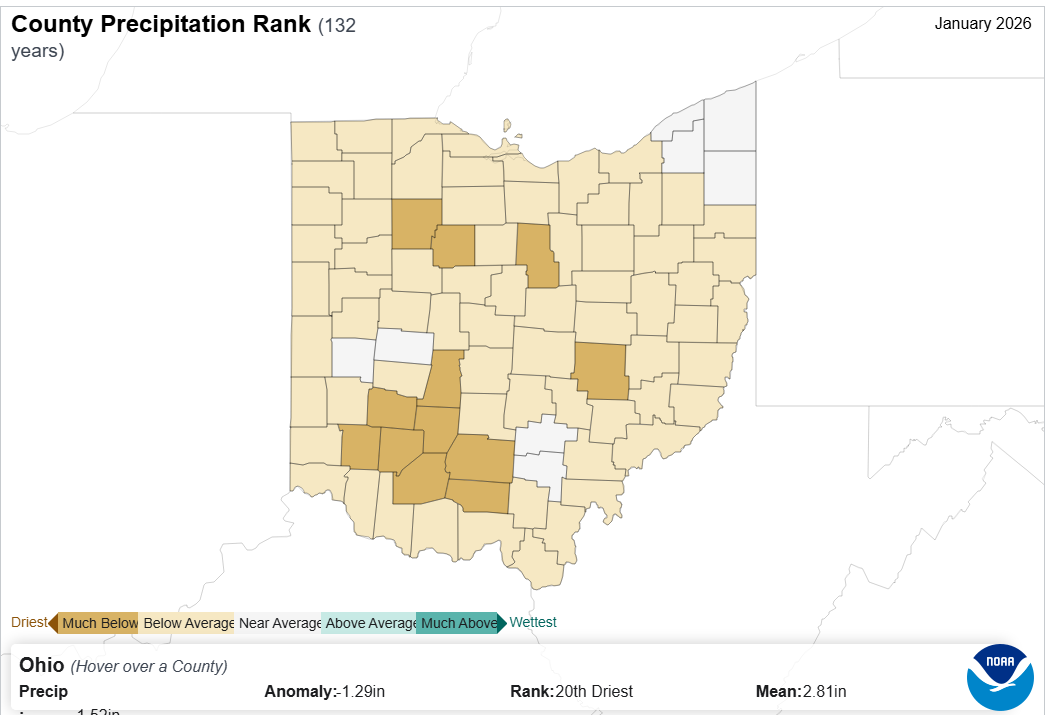
On a county scale, all but eight counties recorded below-average precipitation in January. The driest counties were primarily concentrated in southcentral Ohio, with a few scattered across central Ohio. Near-average precipitation totals were mainly observed in northeastern Ohio, along with a small number of counties in central Ohio (Fig. 4). Overall, this January ranked as the 20th driest on record for the state, with an average precipitation total of 2.81 inches.
Soil & Energy
With drought conditions persisting in northwestern Ohio, both the 0–40 cm and 0–200 cm soil depths in this region, along with much of central and southern Ohio, exhibited very dry soils. These areas fell within the 2nd percentile of soil moisture availability for the 0–40 cm layer, indicating extreme dryness. Even with the winter storm that occurred towards the end of January, the frozen ground and cold temperatures are preventing moisture from saturating the soil. In contrast, northeastern, central, and southeastern Ohio maintained soil moisture levels closer to normal (Fig. 5a). Digging deeper, the 0–200 cm soil depth revealed even more severe moisture deficits, leaving very little of the state with near-normal soil moisture conditions (Fig. 5b).
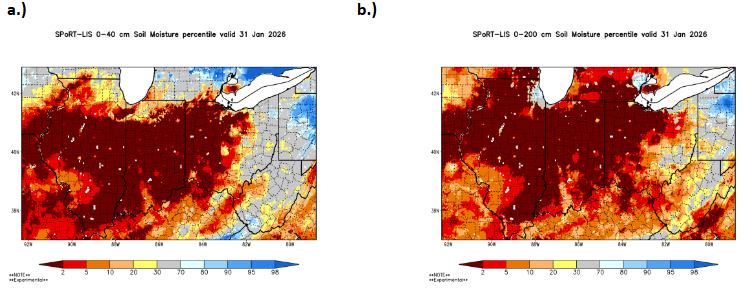
Product Note: Both NASA SPoRT LIS soil moisture products contain small pockets of inaccurate data indicating extremely wet or dry conditions. These small-scale errors can emerge in remote sensing products covering large areas or grid-spacings. For more information, please contact Geddy Davis (davis.5694@osu.edu).
The Midwestern Regional Climate Center reported 0 Cooling Degree Days (CDDs) across all climate divisions in January, while Heating Degree Days (HDDs) were predominantly above normal statewide (Fig. 6). In total, Ohio recorded 1,293 HDDs, indicating increased energy demand for heating. These elevated HDD values reflect the predominantly colder-than-normal temperatures observed across most regions of the state.

Notable Event
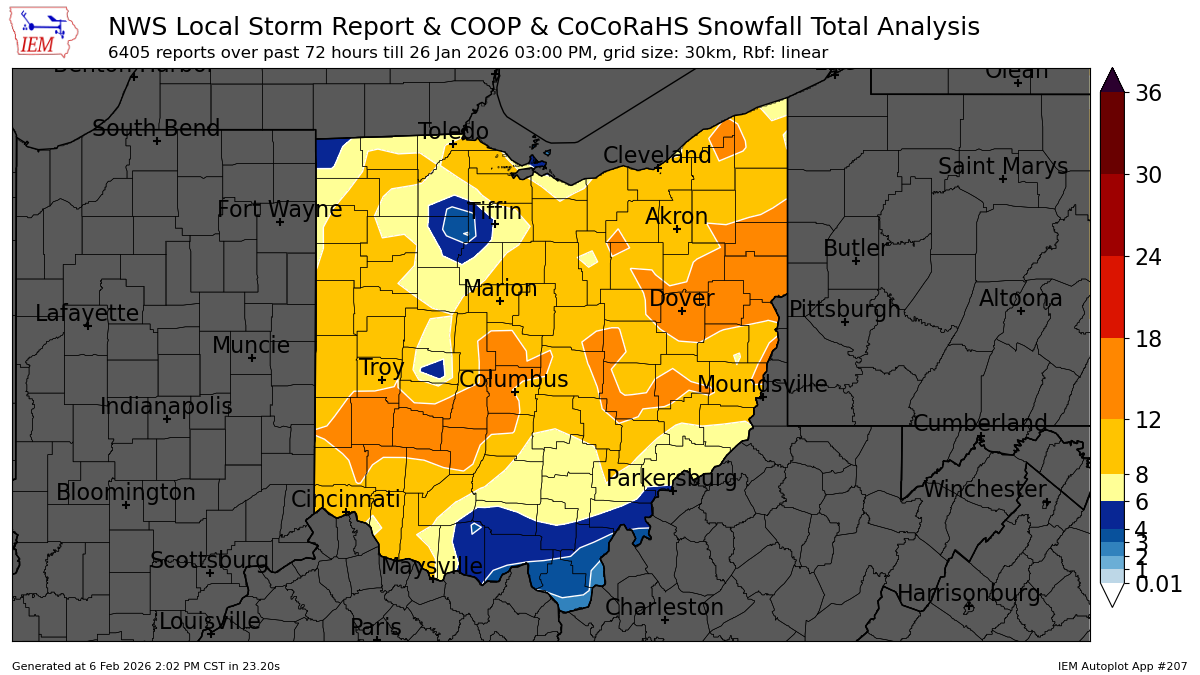
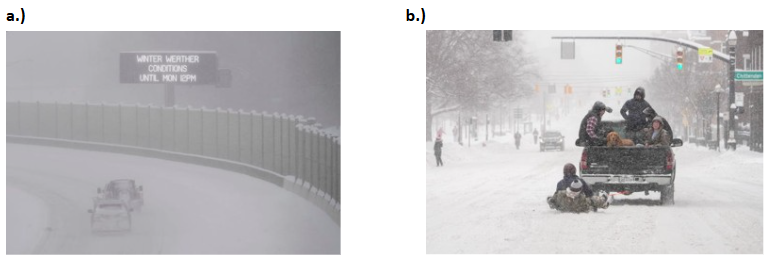
A major winter storm, which impacted the United States from January 22 to 30, brought some of the most significant winter weather since the 2021 Texas power crisis. Nationwide, the storm was responsible for 153 confirmed fatalities and over 30,000 flight cancellations. The northeastern United States received widespread snowfall totaling 1 to 2 feet, while the southern states experienced severe ice storms, with ice accumulations approaching one inch in some areas. In Ohio, the heaviest snowfall totals ranged from 12 to 18 inches across a swath from southwest to northeastern regions (Fig. 7). Daily snowfall records were broken on January 25 in Dayton, Cincinnati, and Columbus. Travel impacts were severe, with major highway disruptions and the issuance of Level 3 snow emergencies, prohibiting nonessential travel (Fig. 8a). In addition to heavy snowfall, the storm ushered in a prolonged period of bitter cold, with highs in the teens across most of Ohio and overnight lows reaching into the negatives. Despite average temperatures ranging from 12 to 15°F, students on The Ohio State University campus embraced the conditions, engaging in activities such as sledding and even being towed behind vehicles (Fig. 8b). Widespread double-digit snowfalls are relatively rare, and with sustained cold in place, any melting was prevented. As a result, snow relocation operations were implemented to clear streets and restore normal day-to-day travel.
Looking Ahead
The Climate Prediction Center has left most of Ohio with equal chances of above or below normal temperatures. Southern Ohio, however, is in the slight sliver of possibly having above normal temperatures with a 33-40% chance (Fig. 9a). The seasonal precipitation outlook is predicting leaning above the normal amount of precipitation for the spring season with a 40-50% chance (Fig. 9b).
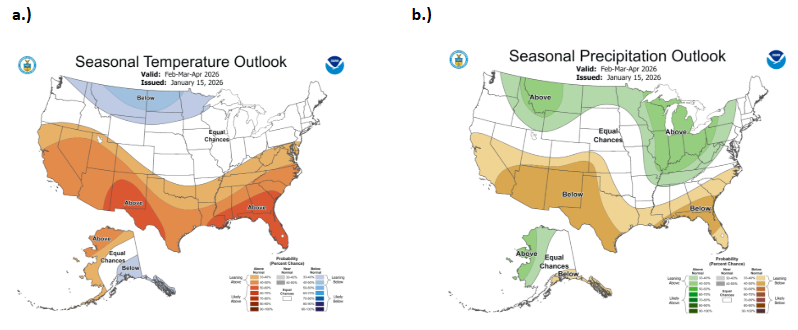
With planting season approaching, these seasonal outlooks, particularly for precipitation, could significantly influence early crop development. As soil is tilled in preparation for planting, heavy rainfall events may increase runoff, potentially washing away freshly planted seeds and degrading soil quality. On the other hand, northwest and north-central Ohio are still undergoing drought, and with a potential increase in precipitation, relief in these areas could be a possibility. This spring, closely monitoring weather forecasts will be essential for properly timing planting operations and minimizing risk, ultimately helping to maximize crop yields.
Note: these outlooks do not provide the quantity of above or below normal conditions, just the likelihood of occurrence (i.e., the probability).
Authors
Alexis Jahnke: Undergraduate Student, Student Assistant: Climate Services, Byrd Polar and Climate Research Center, The Ohio State University, jahnke.30@osu.edu
Aiden Ridgway: Undergraduate Student, Student Assistant: Climate Services, Byrd Polar and Climate Research Center, The Ohio State University, ridgway.72@osu.edu
Geddy R. Davis: Meteorologist/Atmospheric Scientist, Program Coordinator: Climate Services - Byrd Polar and Climate Research Center, The Ohio State University, davis.5694@osu.edu
Aaron B. Wilson: State Climate Office of Ohio, Byrd Polar and Climate Research Center & OSU Extension, The Ohio State University, wilson.1010@osu.edu
