
Provided by the State Climate Office of Ohio, a collaboration of the Byrd Polar and Climate Research Center, Geography Department, and OSU Extension with support from Energent Solutions.
Subscribe to the Monthly Ohio Climate Summaries and Outlooks
Temperature
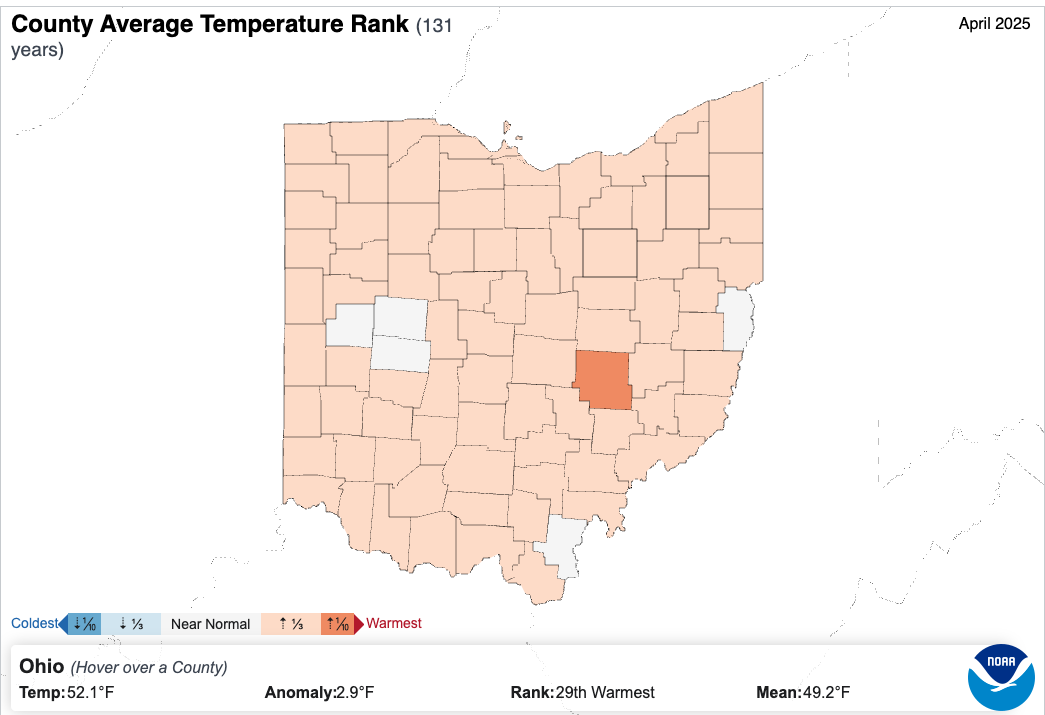
Ohio experienced typical spring temperatures in April. Most areas saw average temperatures between 50–55°F, with slightly cooler readings (45–50°F) in the northeast and northwest, and warmer conditions (55–60°F) in the southeast and southwest (Fig. 1a). Compared to historical averages, temperatures across the state were generally 1–2°F warmer than normal, with a few isolated spots ranging from 2–3°F above normal and some areas 1–2°F below normal (Fig. 1b).

At the county level, this slightly warmer-than-normal trend led to most counties landing in the warmest third of their 131-year record. Exceptions to this include Muskingum County, which made it just inside the warmest tenth of their record, and a few other counties which fell near normal. (Fig. 2). In total, this was the 29th warmest April on record for the state.
Precipitation
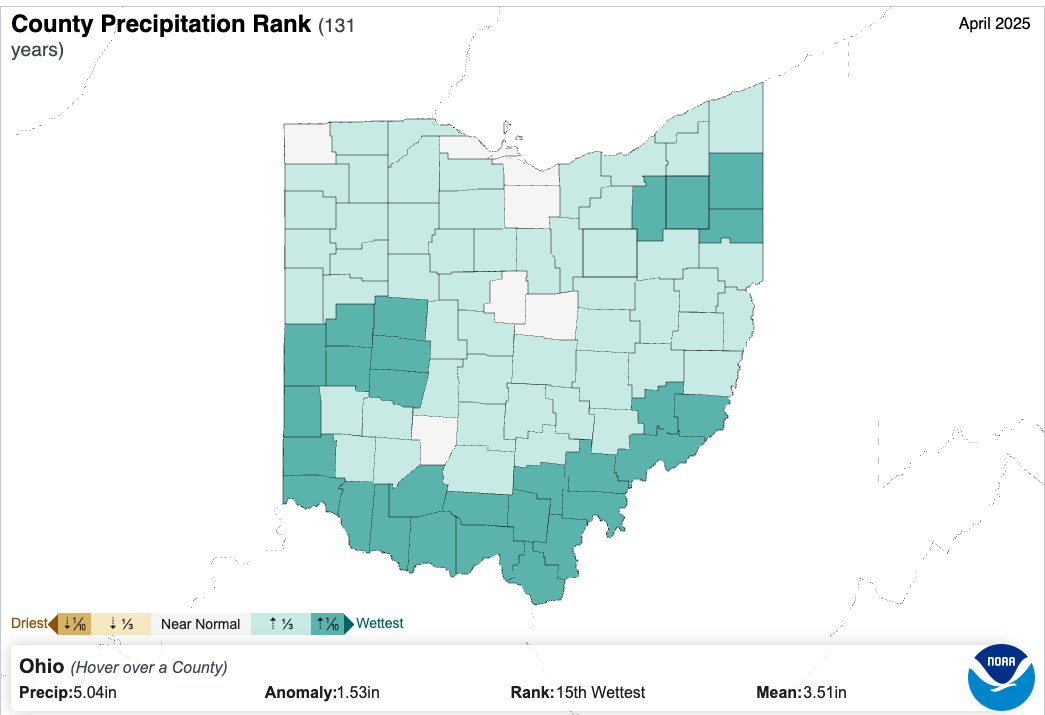
Precipitation across Ohio was above normal in April with many areas seeing repeated rounds of rainfall. Total rainfall ranged from 3–5 inches in the northwest and eastern portions of the state, while most other areas recorded between 5–7.5 inches. A small region in the southwest received even higher amounts, with totals between 7.5 and 10 inches (Fig. 3a). Compared to historical averages, most of Ohio experienced between 0–2 inches above normal precipitation, with a larger surplus of 2–4 inches observed in the southern region. Isolated areas along the northern border recorded slightly below-average totals, with deficits of up to 2 inches (Fig. 3b).

County level data confirms these observations, with numerous southern and western Ohio counties experiencing a top-10 wettest April on record, and many other counties landing in the wettest third of their record (Fig. 4).
Soil & Energy
At the end of April, soil moisture levels across most of Ohio were near normal. The shallow soil moisture map (0–40 cm depth) showed that conditions were generally typical for this time of year, with drier-than-normal soils in parts of northwest Ohio and wetter-than-normal areas in the southwest and eastern portions of the state (Fig. 5a). The deeper soil moisture profile (0–200 cm) revealed a similar pattern, with most areas falling within the 30th to 70th percentile range, indicating near-normal conditions overall (Fig. 5b).
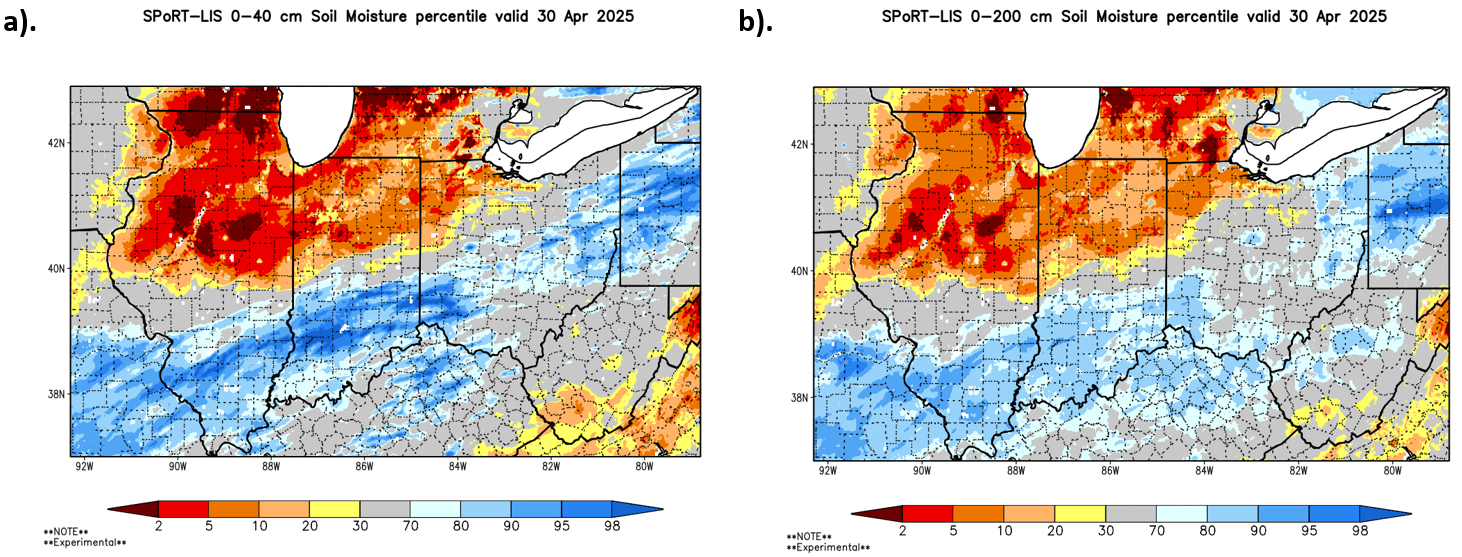
Product Note: Both NASA SPoRT LIS soil moisture products contain small pockets of inaccurate data indicating extremely wet or dry conditions. These small-scale errors can emerge in remote sensing products covering large areas or grid-spacings. For more information, please contact Geddy Davis (davis.5694@osu.edu).
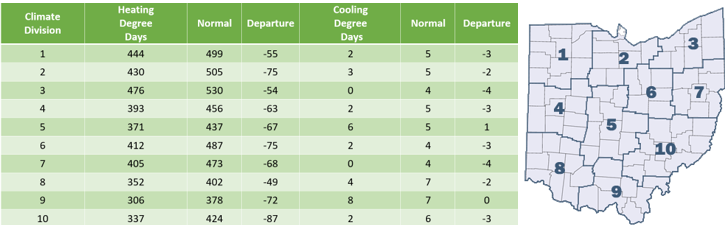
Slightly warmer-than-average temperatures in April contributed to a reduction in Heating Degree Days (HDDs), meaning less energy was needed for indoor heating. A few Cooling Degree Days (CDDs) were also recorded due to occasional warmer temperatures, but these values remained lower than normal for this time of year (Fig. 6).
Notable Events
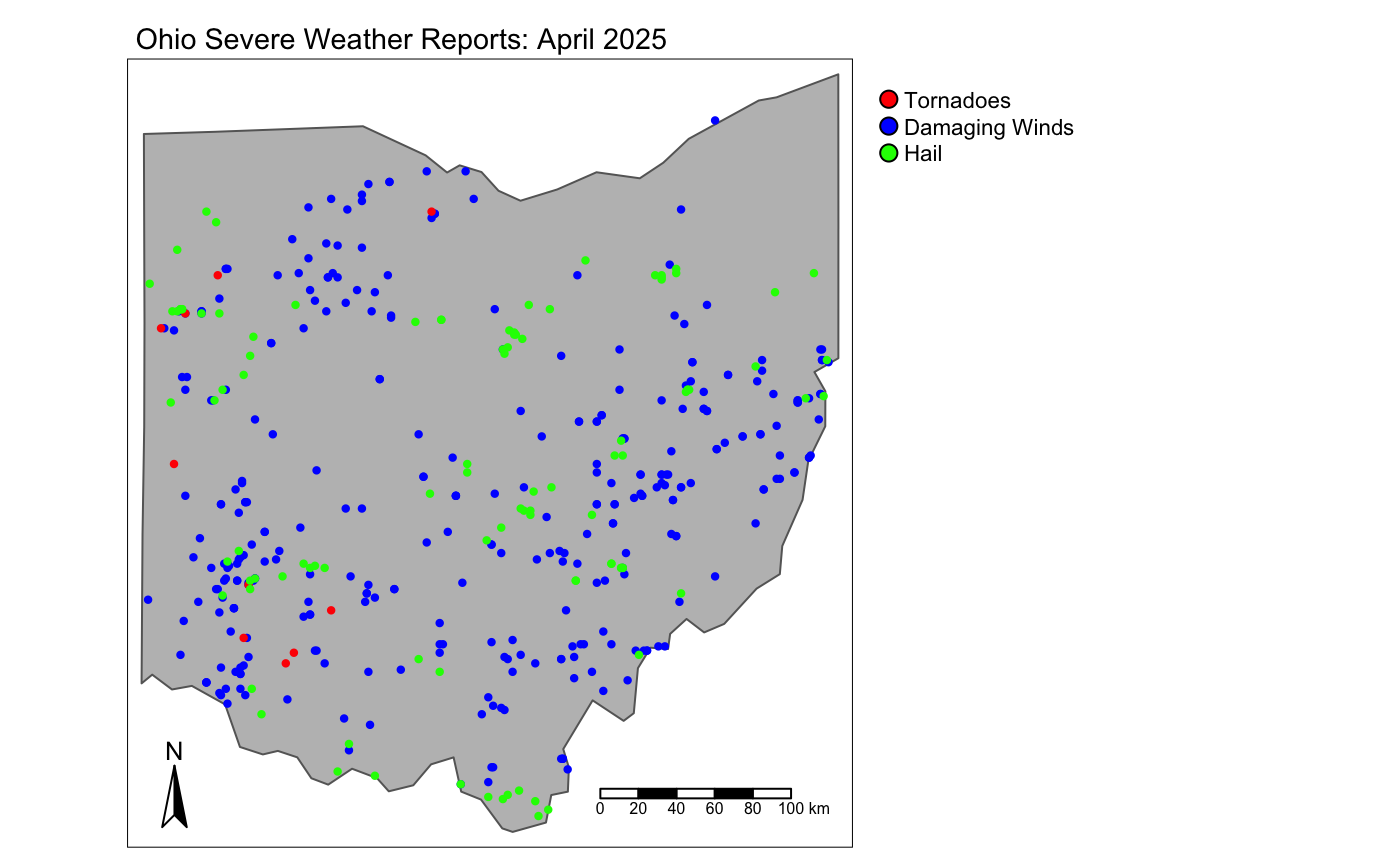
April brought several large-scale weather systems, a few of which produced some notable severe weather. The most significant event occurred on April 2–3, when waves of thunderstorms produced morning hail, followed by a squall line of strong storms in the afternoon and evening that brought damaging winds and tornadoes (Fig. 7). Hail measuring one to two inches in diameter was reported primarily across western Ohio but extending across the state. Widespread wind gusts reaching up to 65 mph caused damage, including downed trees and barns. A total of nine tornadoes were confirmed, including six EF0s, two EF1s, and one EF2 tornado near Dupont, Ohio. While this system had a notable impact in Ohio, the most severe damage was concentrated in Missouri, Illinois, Arkansas, Kentucky, and Indiana.

Seven other days this month featured thunderstorms that produced severe weather. These events brought heavy rainfall, large hail, damaging winds, and a few small tornadoes (Fig. 8). The frequency and intensity of these storms contributed to higher-than-normal precipitation levels, leading to widespread flooding across the state. This was further exacerbated by heavy rains at the end of March and the beginning of May. Many rivers, including the Ohio River, reached flood stage, resulting in multiple road closures due to inundation. These repeated severe weather events underscore the importance of preparedness and awareness during peak storm seasons.
Looking Ahead
The latest Climate Prediction Center (CPC) seasonal outlooks suggest a tendency toward warmer-than-average temperatures across Ohio and wetter conditions for the eastern half of the state. The seasonal temperature outlook shows a slight tilt toward above-average temperatures, though confidence remains low overall, with the highest certainty along Ohio’s eastern border (Fig. 9a). The precipitation outlook indicates equal chances for above- or below-average precipitation in the western half of the state, while slightly favoring above-average precipitation in the east, again with limited confidence (Fig. 9b).
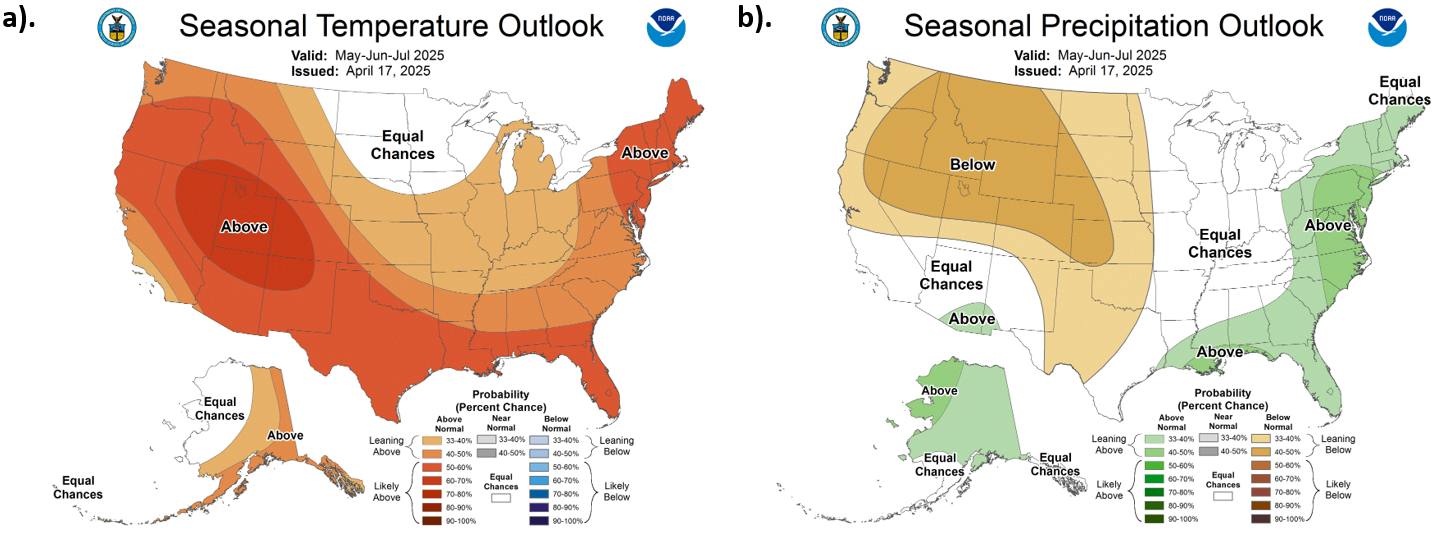
Due to the low confidence in both temperature and precipitation forecasts, the potential impacts remain uncertain. Continued monitoring of short-term weather patterns and updated seasonal guidance will be important for anticipating any emerging risks or opportunities related to seasonal climate variability.
Note: these outlooks do not provide the quantity of above or below normal conditions, just the likelihood of occurrence (i.e., the probability).
Authors
Aiden Ridgway: Undergraduate Student, Student Assistant: Climate Services, Byrd Polar and Climate Research Center, The Ohio State University, ridgway.72@osu.edu
Geddy R. Davis: Meteorologist/Atmospheric Scientist, Program Coordinator: Climate Services - Byrd Polar and Climate Research Center, The Ohio State University, davis.5694@osu.edu
Aaron B. Wilson: State Climate Office of Ohio, Byrd Polar and Climate Research Center & OSU Extension, The Ohio State University, wilson.1010@osu.edu