Provided by the State Climate Office of Ohio, a collaboration of the Byrd Polar and Climate Research Center, Geography Department, and OSU Extension with support from Energent Solutions.
Subscribe to the Monthly Ohio Climate Summaries and Outlooks
Temperature
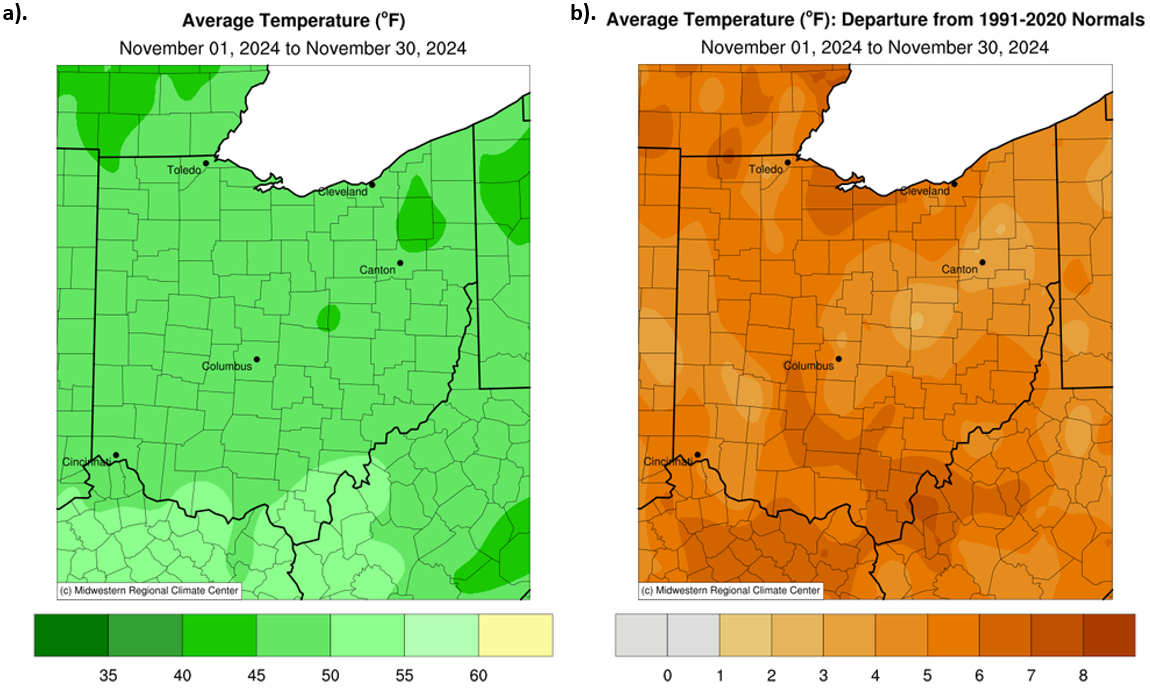
Ohio experienced another month of above-average temperatures in November. Statewide, average temperatures were relatively uniform, with most areas reporting values between 45°F and 50°F, with only minor deviations in a few locations (Fig. 1a). Departures from normal varied significantly, with northern and southern regions observing increases of 5–7°F above normal, while the remainder of the state recorded anomalies of 3–5°F above normal (Fig. 1b).
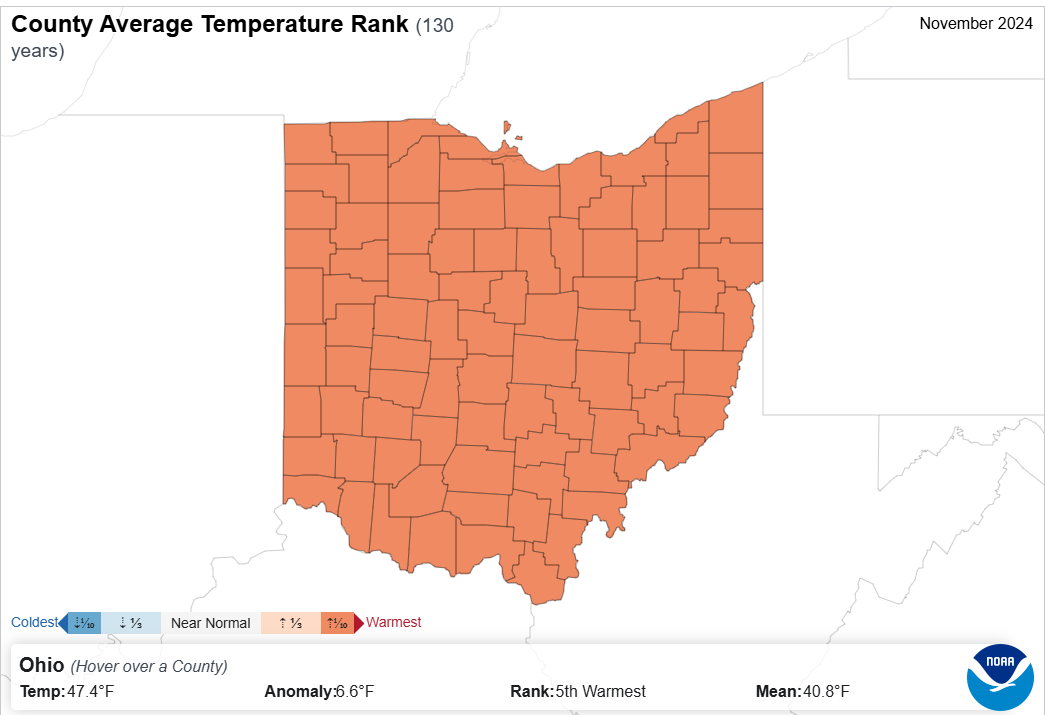
In November, every county in Ohio ranked within the warmest tenth of their 130-year temperature records. Notably, Fulton, Hancock, Lucas, Williams, and Wood Counties experienced their third warmest November on record, while 24 other counties recorded their fourth warmest. Statewide, Ohio observed its fifth warmest November in the 130-year record (Fig. 2).
Precipitation
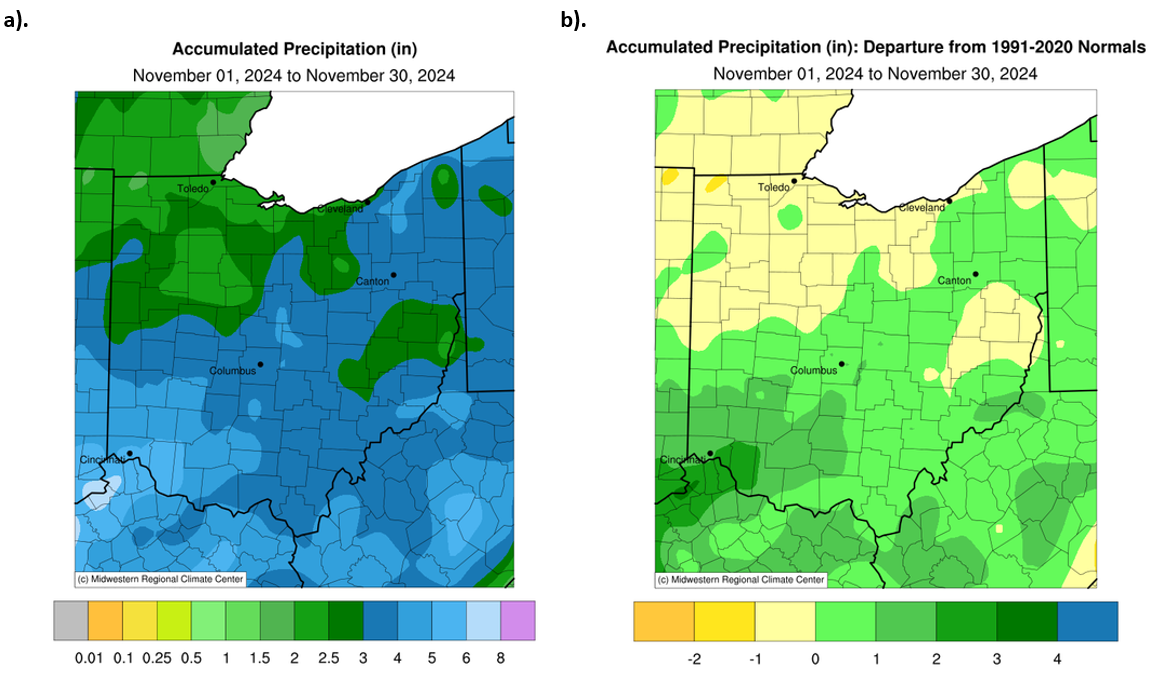
Compared to previous months, much of Ohio experienced near-normal precipitation levels in November. Precipitation totals ranged from 2 to 3 inches in the northwest to 3 to 5 inches across the rest of the state (Fig. 3a). Departures from normal revealed a slight deficit of 0 to 1 inch below normal in the northwest, while the remainder of Ohio recorded 0 to 1 inch above normal. Notably, the extreme southwest saw precipitation 1 to 3 inches above normal (Fig. 3b).
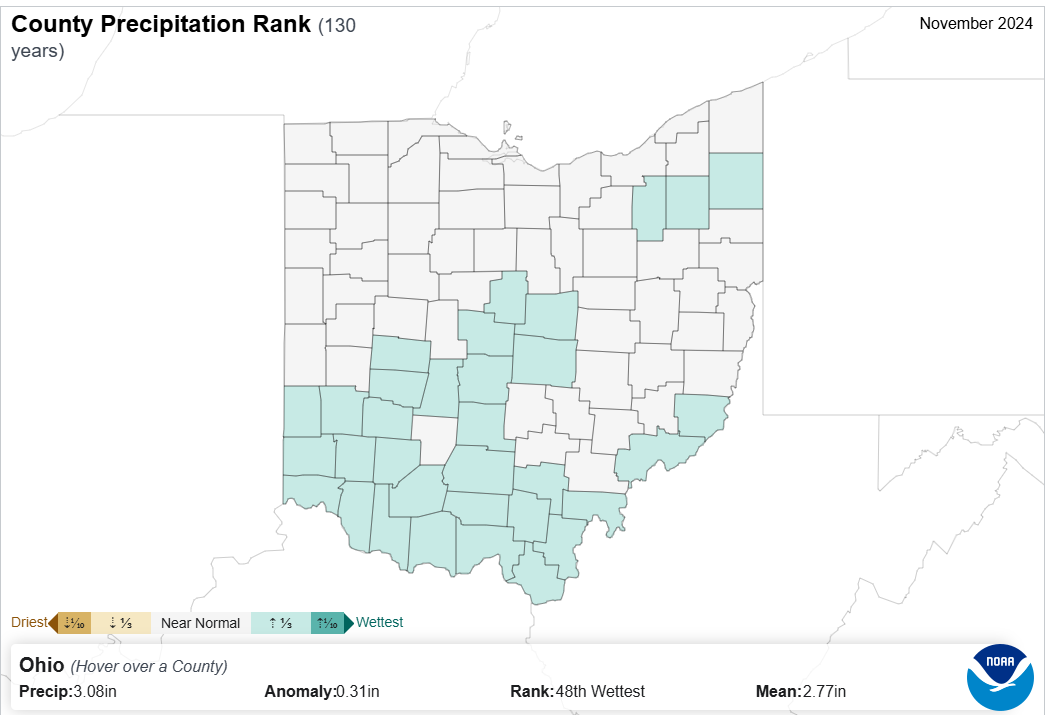
At the county level, most of Ohio experienced near-normal precipitation in November. However, many counties in the southwest stood out, ranking within the wettest third of their 130-year records. Overall, the state recorded its 48th wettest November, with 33 counties falling in the wettest third (Fig. 4).
Soil & Energy
Ohio's soil conditions improved significantly in November, although dry conditions persist in some areas. The 0–40 cm soil moisture map highlights extremely dry conditions in the northwest, while soil moisture levels across the rest of the state are much closer to normal (Fig. 5a). The 0–200 cm soil moisture map reveals a similar pattern, with extreme dryness in the northwest and broader dryness throughout the state. This is likely because recent late-November precipitation has not yet fully percolated into the deeper soil layers (Fig. 5b).
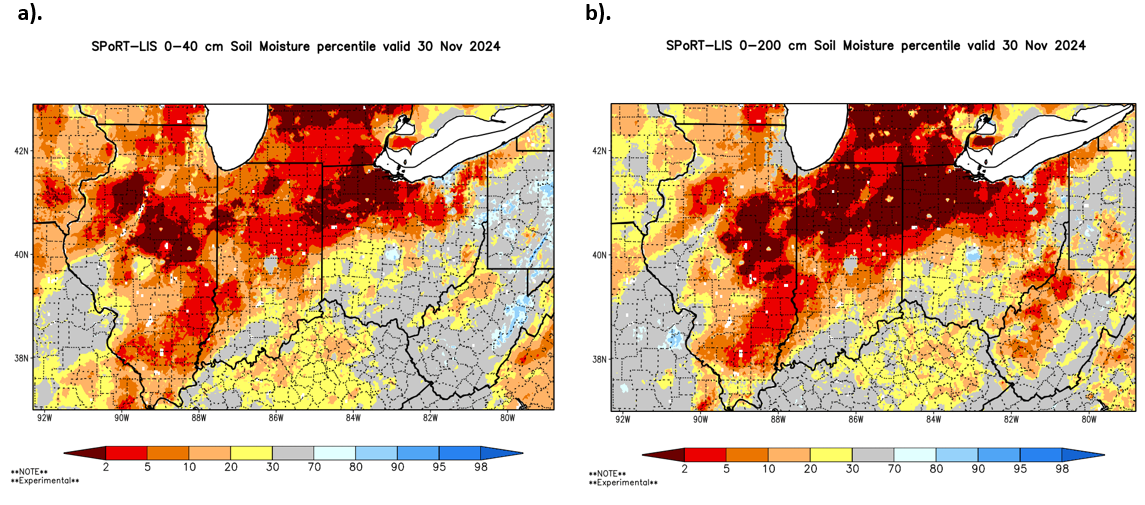
Product Note: Both NASA SPoRT LIS soil moisture products contain small pockets of inaccurate data indicating extremely wet or dry conditions. These small-scale errors can emerge in remote sensing products covering large areas or grid-spacings. For more information, please contact Geddy Davis (davis.5694@osu.edu).
November saw a significant increase in Heating Degree Days (HDDs) due to the seasonable temperatures but the total number is still below normal. In contrast, Cooling Degree Days (CDDs) dropped to single digits. Despite these changes, the total HDDs remain well below normal for this time of year meaning that not many people would be running heat. This helps the energy sector by providing a slower transition into the winter season which is typically dominated by large amounts of HDDs (Fig. 6).

November saw a significant increase in Heating Degree Days (HDDs) due to the seasonable temperatures but the total number is still below normal. In contrast, Cooling Degree Days (CDDs) dropped to single digits. Despite these changes, the total HDDs remain well below normal for this time of year meaning that not many people would be running heat. This helps the energy sector by providing a slower transition into the winter season which is typically dominated by large amounts of HDDs (Fig. 6).
Notable Events
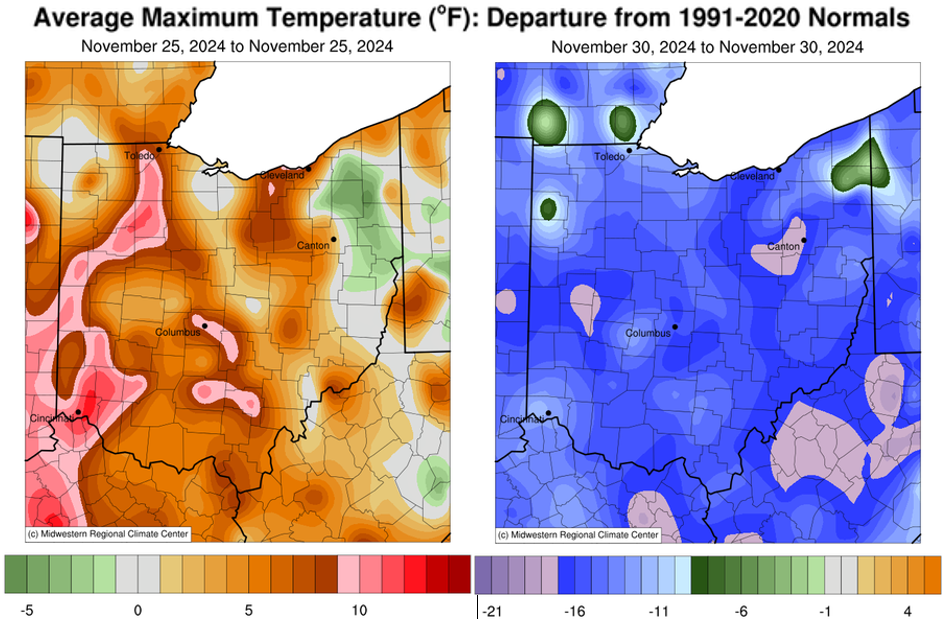
November was relatively calm in terms of significant weather events. However, during Thanksgiving week, high temperatures dropped from the 60s to the 30s over just five days as a strong cold front moved through the region. This shift was caused by a ridging pattern that allowed bursts of Arctic air to flow into the Midwest. Parts of western and southern Ohio saw dramatic temperature swings, going from 13°F above average to 17°F below average (Fig. 7). The front also brought low temperatures down to the teens and widespread precipitation, resulting in a mix of rain and snow. Central Ohio recorded up to 1.5 inches of precipitation. These colder conditions lingered into the first week of December.
Drought
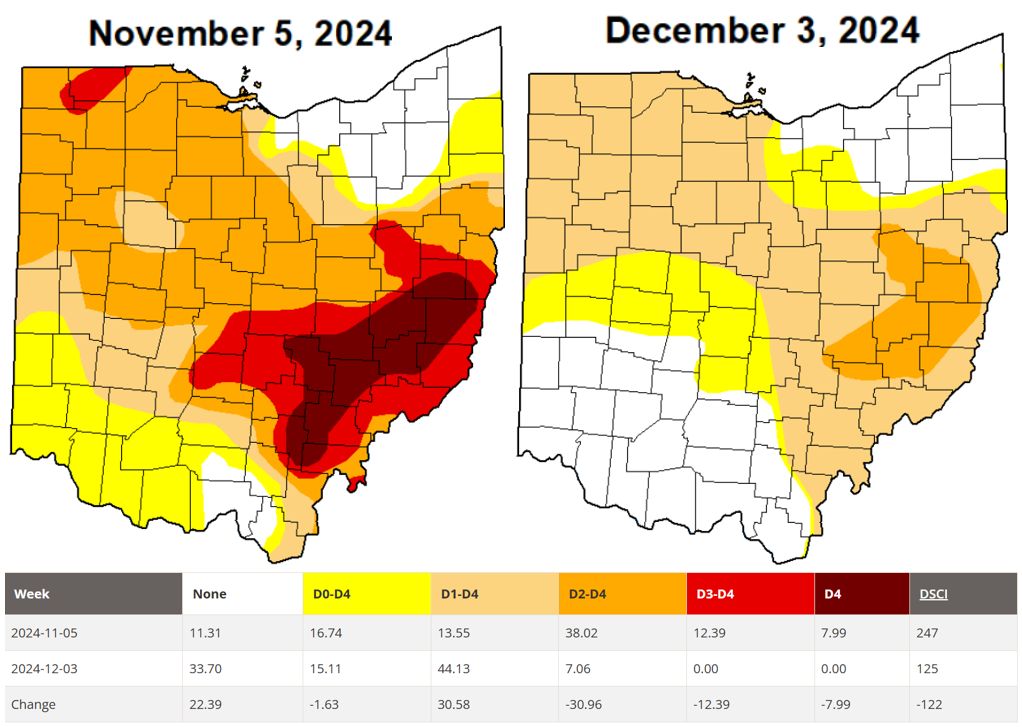
Drought conditions in Ohio have significantly improved in recent weeks, with all D4 (Exceptional Drought) and D3 (Extreme Drought) conditions fully eliminated. This marks a significant improvement since D3 has been on the map since August 13th. Additionally, D2 (Severe Drought) has decreased by 30.96%. Currently, 7.06% of the state remains in D2, 44.13% in D1 (Moderate Drought), 15.11% in D0 (Abnormally Dry), and 33.70% is now drought-free (Fig. 8). This improvement is largely attributed to near-to-above-normal precipitation and reduced evaporation rates due to shorter daylight hours. These favorable conditions are expected to persist as long as precipitation remains near normal.
Looking Ahead
The CPC’s 3-month outlook continues to project warmer-than-average temperatures along with above-average precipitation for the remainder of Ohio's winter season. The seasonal temperature outlook suggests warmer-than-average conditions across the state, though with only moderate confidence (Fig. 9a). Similarly, the precipitation outlook indicates the likelihood of above-average precipitation statewide, also with moderate confidence (Fig. 9b).
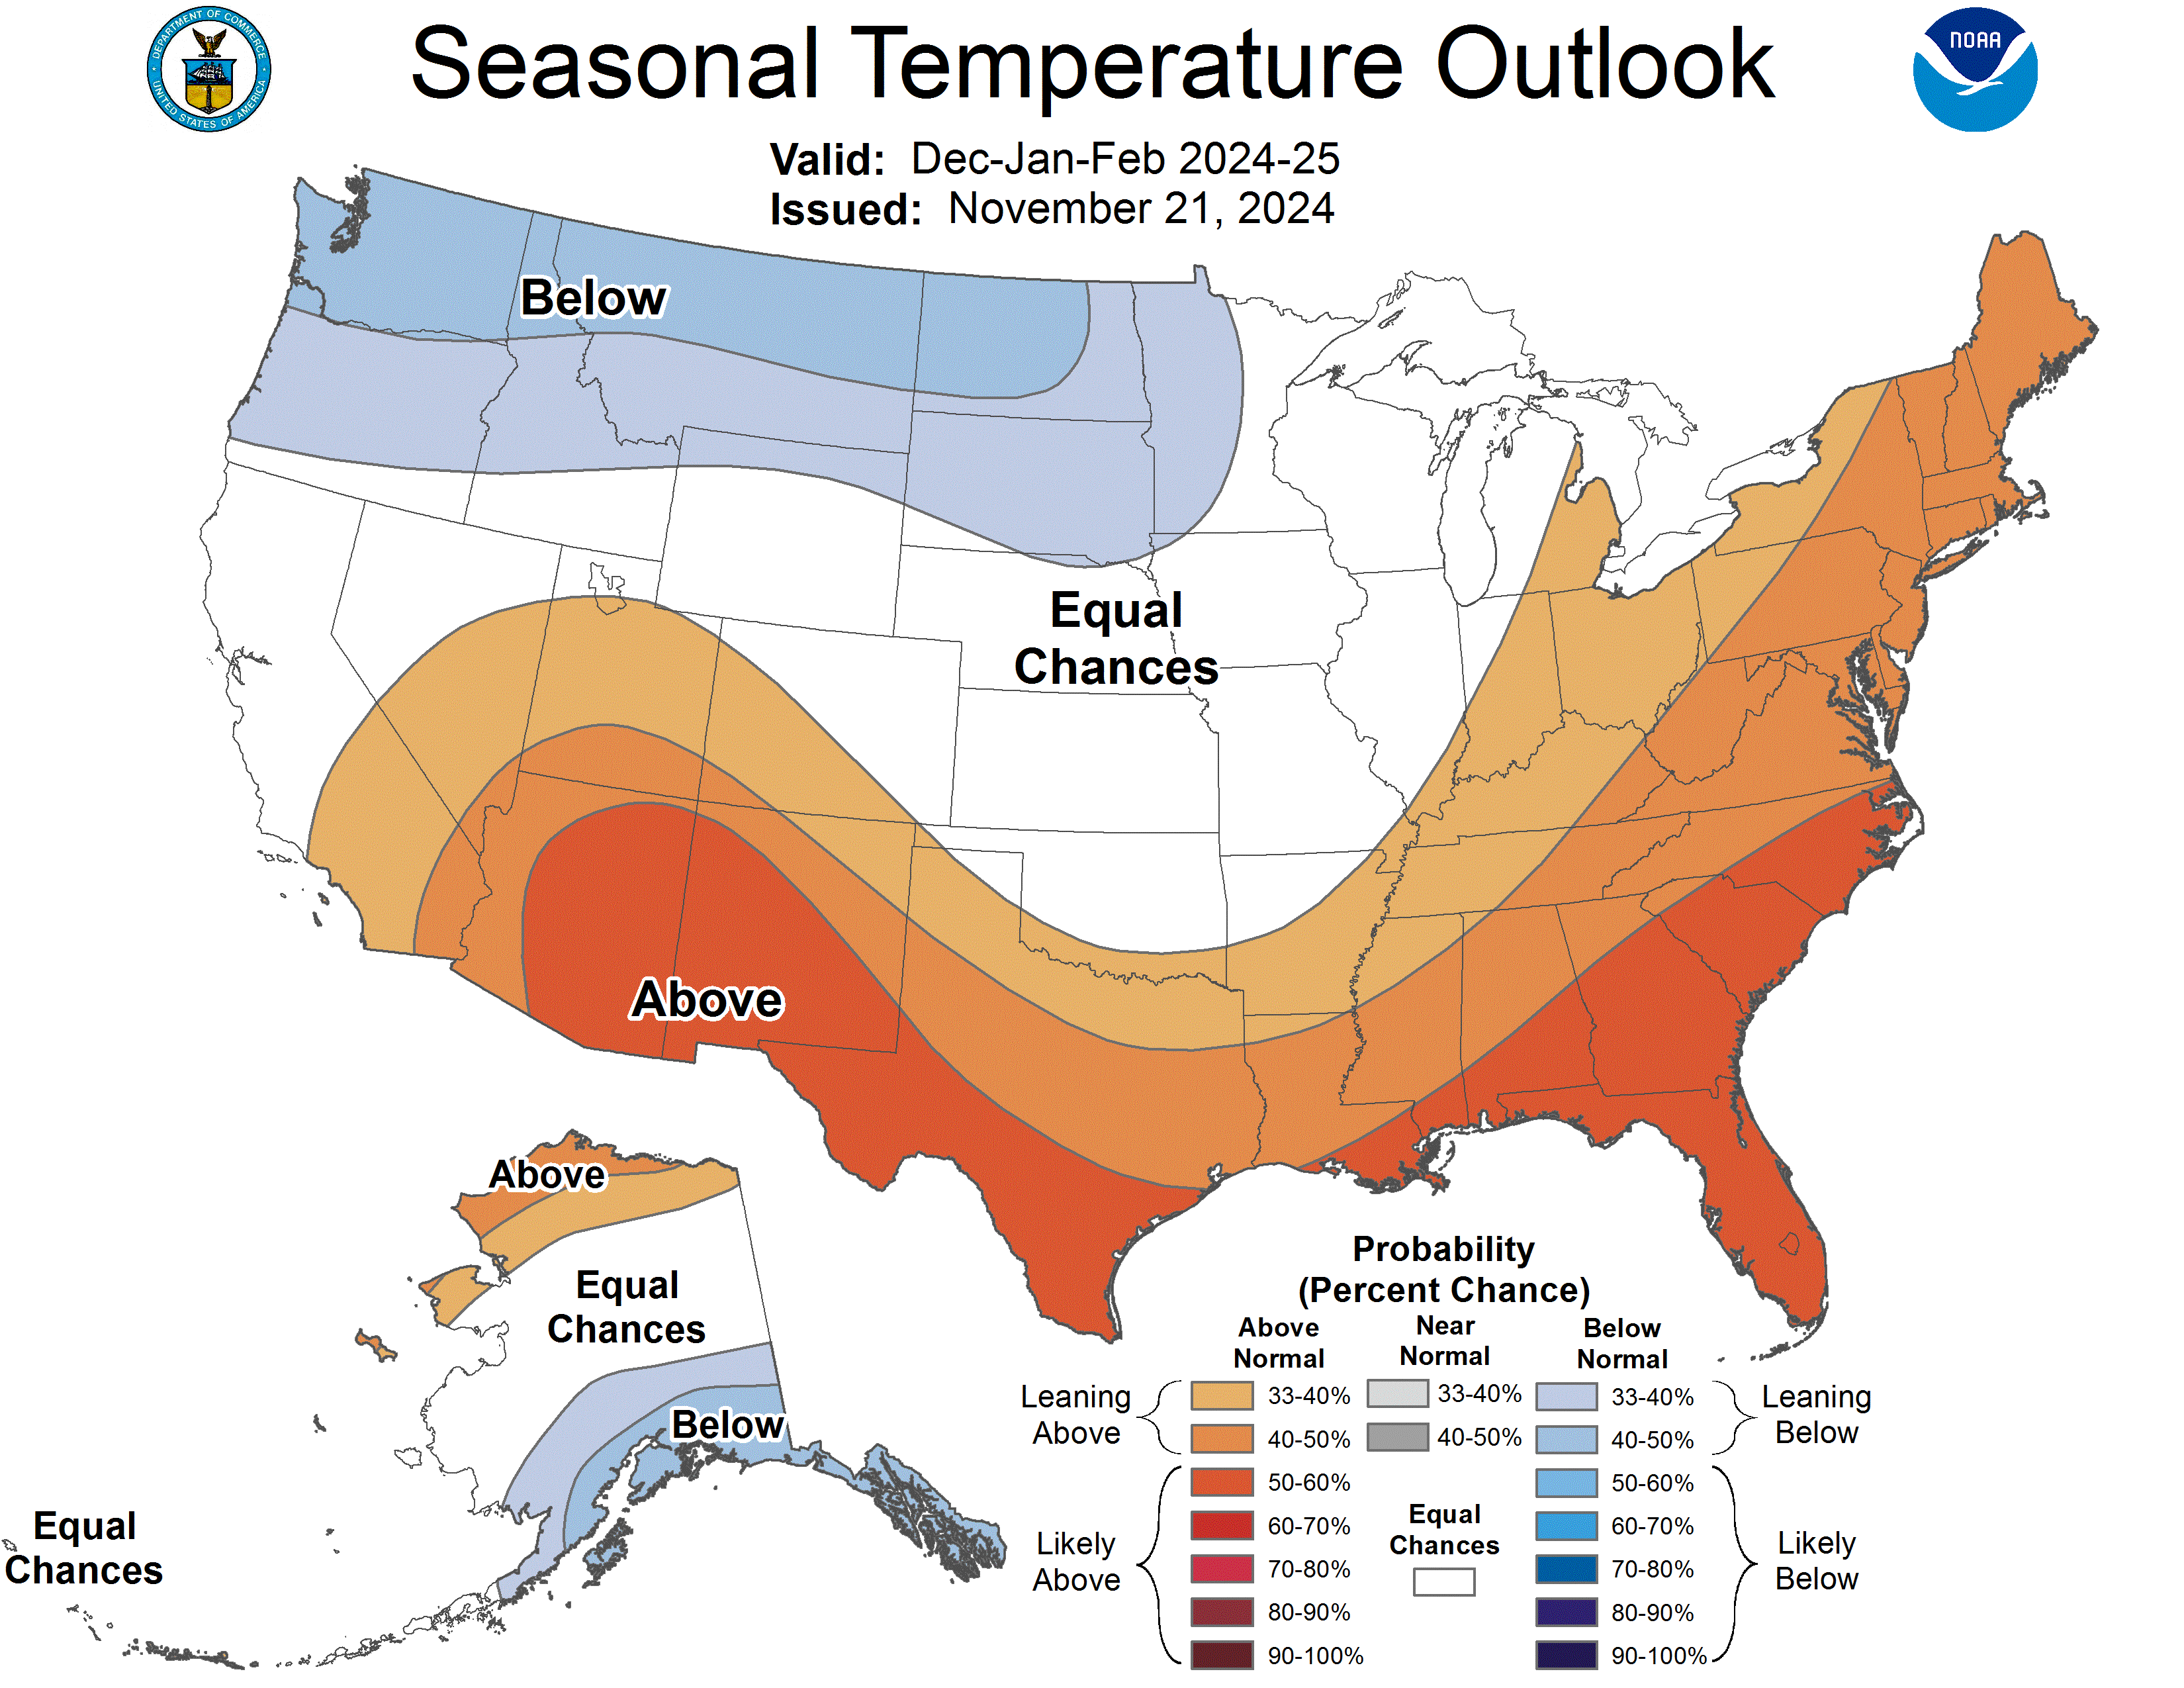
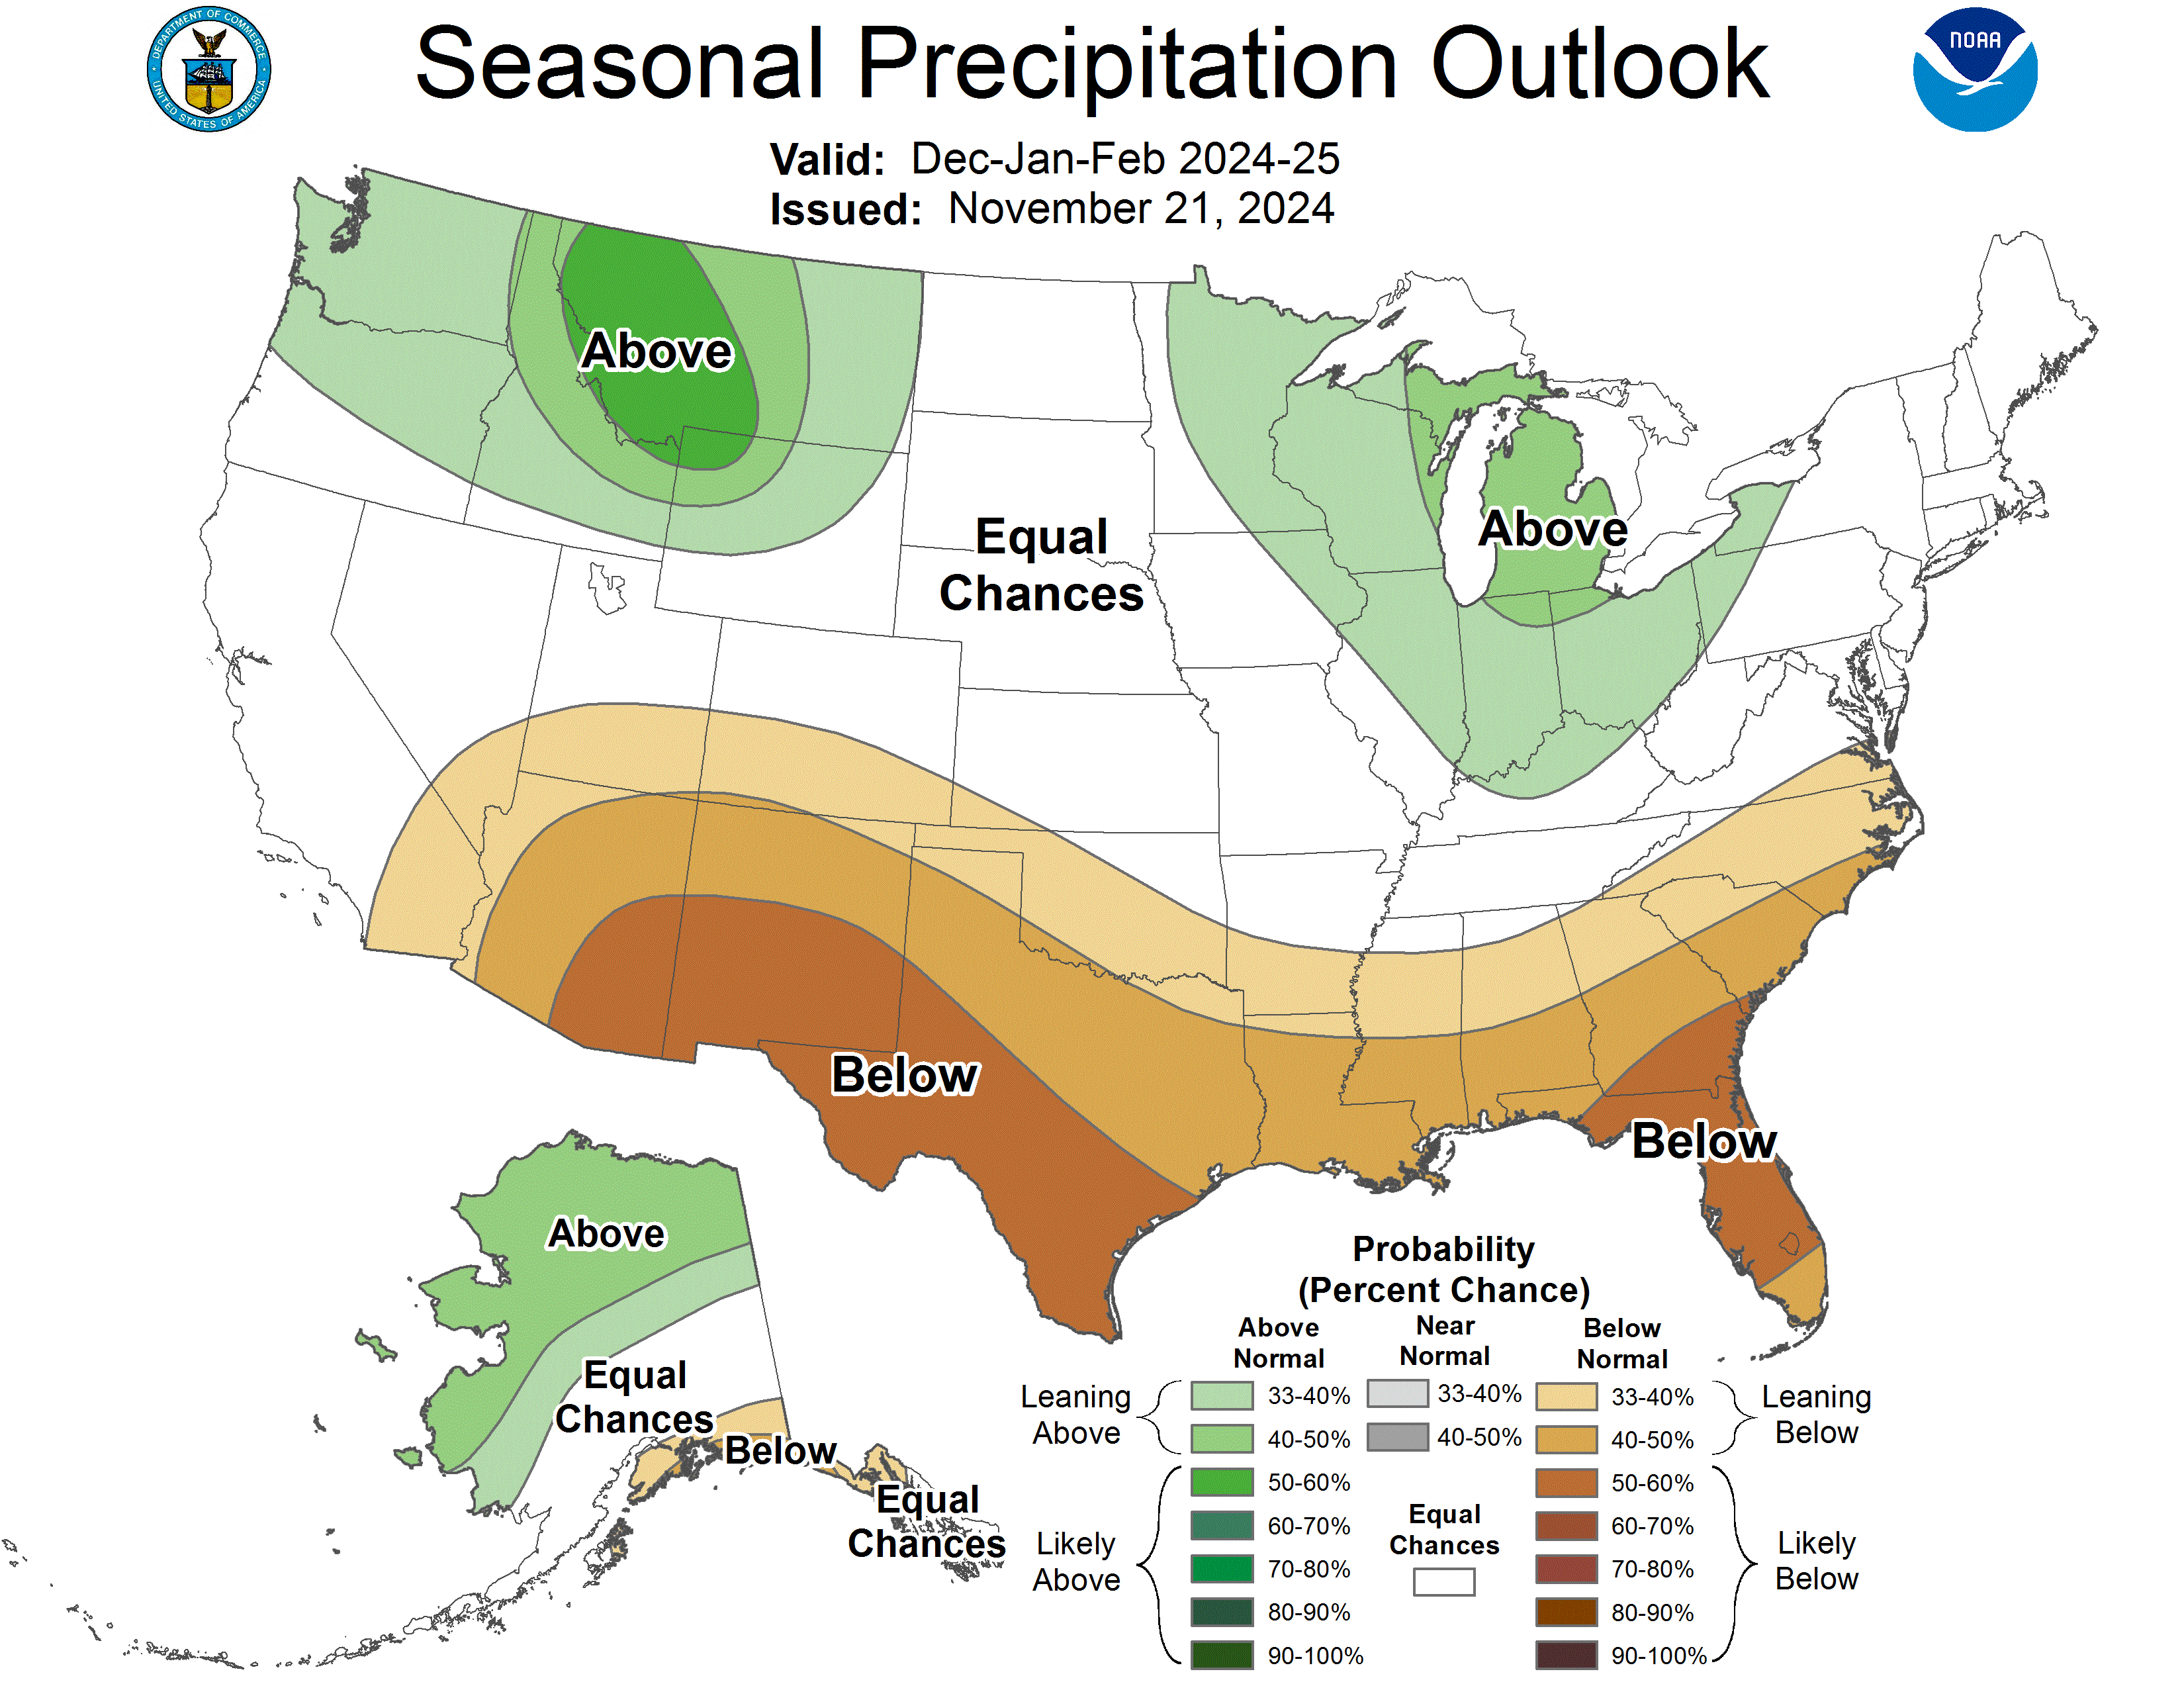
While the seasonal outlook predicts warmer-than-average temperatures, month-to-month conditions often vary and have deviated from prediction so far. Chilly conditions have prevailed to date, and short-term weather models indicate this large pattern is likely going to continue driving bursts of cold Arctic air across the Midwest for now. Despite this, long-term climate models continue to project overall warmer-than-average temperatures for the season, indicating some moderation to come.
Note: these outlooks do not provide the quantity of above or below normal conditions, just the likelihood of occurrence (i.e., the probability).
Authors
Aiden Ridgway: Undergraduate Student, Student Assistant: Climate Services, Byrd Polar and Climate Research Center, The Ohio State University, ridgway.72@osu.edu
Geddy R. Davis: Meteorologist/Atmospheric Scientist, Program Coordinator: Climate Services - Byrd Polar and Climate Research Center, The Ohio State University, davis.5694@osu.edu
Aaron B. Wilson: State Climate Office of Ohio, Byrd Polar and Climate Research Center & OSU Extension, The Ohio State University, wilson.1010@osu.edu
