
Provided by the State Climate Office of Ohio, a collaboration of the Byrd Polar and Climate Research Center, Geography Department, and OSU Extension with support from Energent Solutions.
Temperature and Precipitation
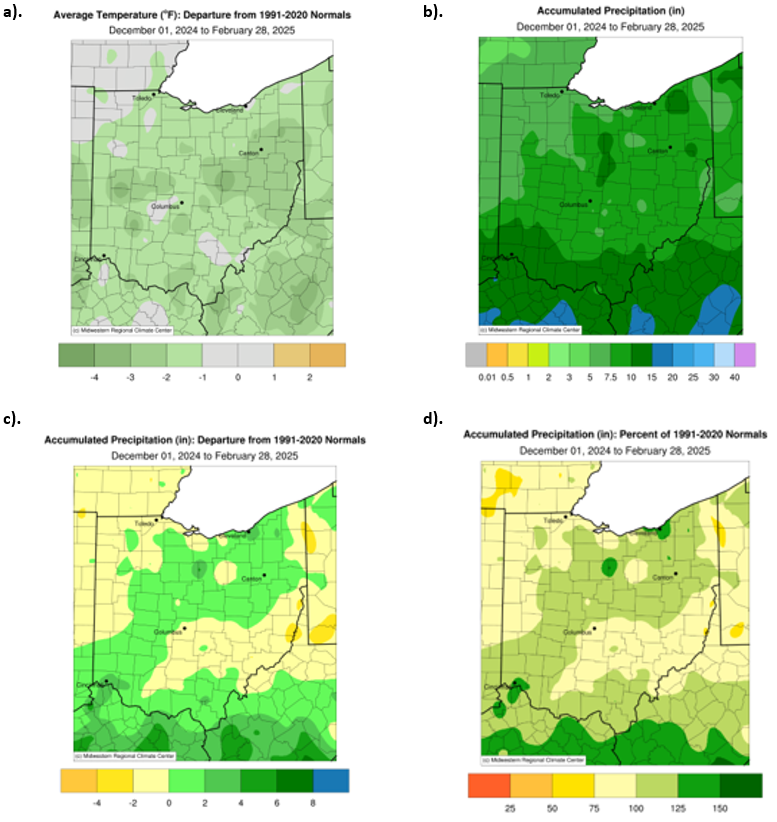
During the winter, Ohio experienced near-normal precipitation levels, while temperatures were below average across the state. The statewide average temperature was 1 to 2°F below normal (Fig. 1a). Most of the state recorded between 7.5 and 10 inches of precipitation, with higher amounts of 10 to 15 inches in the south and lower totals of 5 to 7.5 inches in the northeast (Fig. 1b). Precipitation departures from normal were generally small, with most areas close to average. Some locations saw up to 2 inches below normal, while others, particularly in the south and along the Cleveland-Columbus-Cincinnati corridor, received up to 2 inches above normal (Fig. 1c). The percentage of normal precipitation across the state ranged from 75% to 125% (Fig. 1d). Additionally, the southern portion of the state recorded slightly above-normal snowfall totals this winter.
Soil and Energy
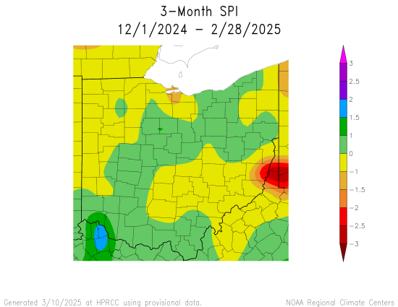
The 3-month Standardized Precipitation Index (SPI) for the winter season indicates a continued return to near-normal soil moisture conditions. Most of the state recorded SPI values between -1 and +1, reflecting generally balanced moisture levels. However, a small pocket of extremely dry conditions persisted near Belmont County due to a lack of precipitation over already-dry soils (Fig. 2).
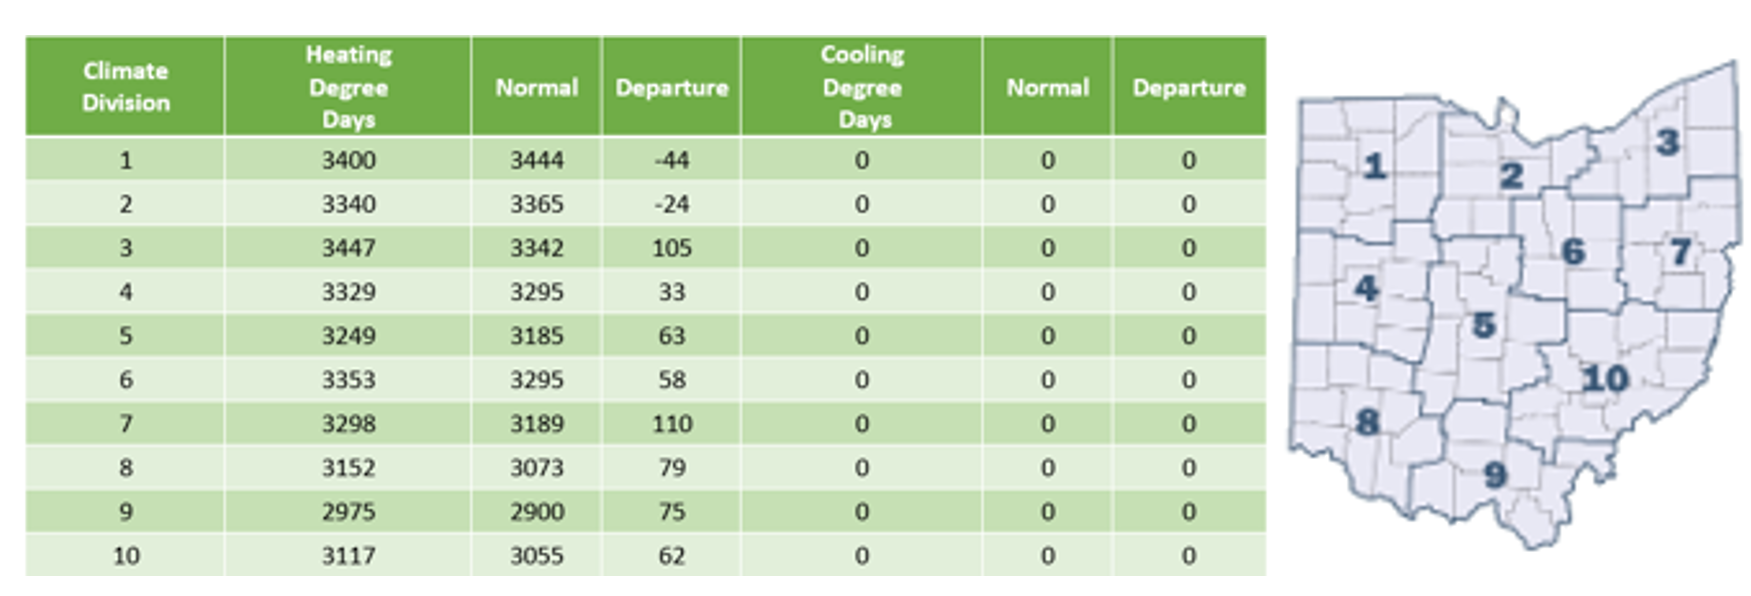
Most regions of the state experienced above-average heating degree days (HDDs), indicating a colder-than-usual winter. However, divisions 1 and 2 recorded below-normal HDDs, suggesting a warmer-than-usual winter in those areas. Overall, the state was near normal on average. As is typical during the winter season, no cooling degree days (CDDs) were recorded (Fig. 3).
Looking Ahead
The Climate Prediction Center (CPC) three-month outlook suggests the probability of warmer-than-average temperatures across Ohio, along with the probability of above-average precipitation, though confidence is limited for both. The seasonal temperature outlook indicates an increased likelihood of warmer-than-normal temperatures throughout most of the state, except for northwestern Ohio, where there are equal chances of above- or below-normal temperatures (Fig. 4a). Meanwhile, the seasonal precipitation outlook projects above-normal precipitation across Ohio with moderate confidence (Fig. 4b).
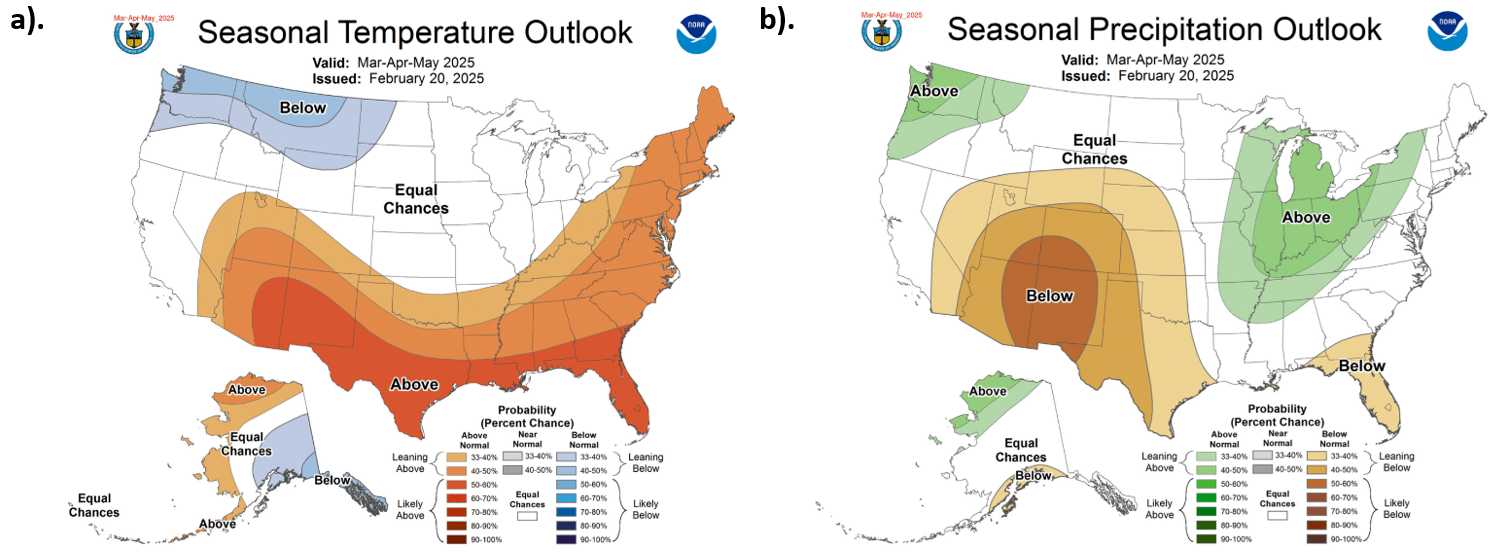
Note: these outlooks do not provide the quantity of above or below normal conditions, just the likelihood of occurrence (i.e., the probability).
A warmer and wetter spring could create favorable conditions for planting by promoting soil moisture and early crop development. However, excessive warmth or precipitation could pose challenges, such as delayed fieldwork, soil saturation, and increased disease risk for certain crops. Additionally, it is important to note that CPC seasonal outlooks provide broad trends rather than week-to-week variability, meaning short-term weather fluctuations—such as late-season frosts, extended dry spells, or excessive rainfall—will play a more significant role in determining optimal planting windows.
Authors
Aiden Ridgway: Atmospheric Sciences Undergraduate, Student Assistant: Climate Services - Byrd Polar and Climate Research Center, The Ohio State University, ridgway.72@osu.edu
Geddy R. Davis: Meteorologist/Atmospheric Scientist, Program Coordinator: Climate Services - Byrd Polar and Climate Research Center, The Ohio State University, davis.5694@osu.edu
Aaron B. Wilson: State Climate Office of Ohio, Byrd Polar and Climate Research Center & OSU Extension, The Ohio State University, wilson.1010@osu.edu