Seasonal Climate Summary: Spring (March - May 2026)
Provided by the State Climate Office of Ohio, a collaboration of the Byrd Polar and Climate Research Center, Geography Department, and OSU Extension with support from Energent Solutions.
Temperature and Precipitation
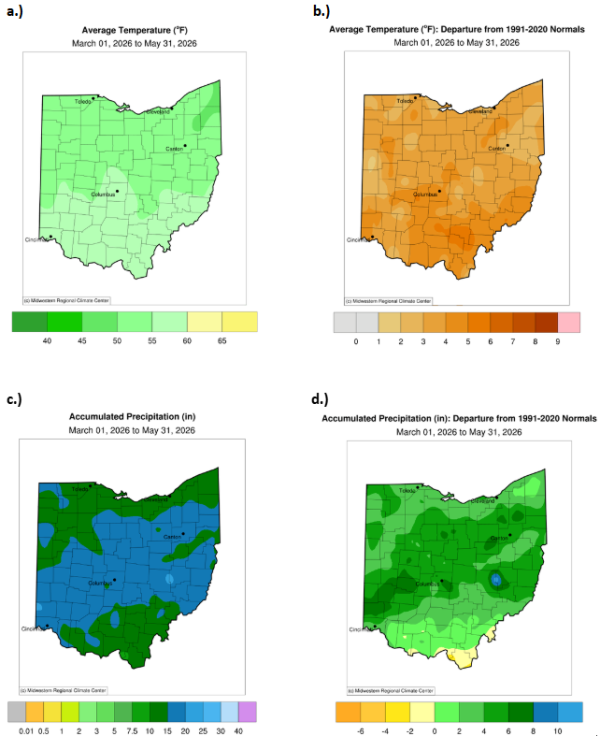
The spring season featured a warm and stormy March, the warmest April on record, and a cooler, rain-filled May. Average temperatures across this period ranged from 50–55°F across northern Ohio and 55–60°F across southern Ohio (Fig. 1a). Historically, these values run up to 4– 5°F above normal (Fig. 1b). Despite two overnight frosts in May, the combination of an exceptionally warm April and a mid-May heat wave pushed the overall spring temperature average higher. Spring rainfall also brought meaningful relief from drought. Ohio has not experienced severe drought since March 31, thanks to substantial precipitation totals this season. Central Ohio received 15–20 inches of rain, with some localized pockets reaching 20–25 inches. Northern and southern Ohio generally measured 10–15 inches (Fig. 1c). Nearly the entire state, aside from portions of the southern edge, finished spring 2– 8 inches above normal for precipitation (Fig. 1d).
Soil and Energy
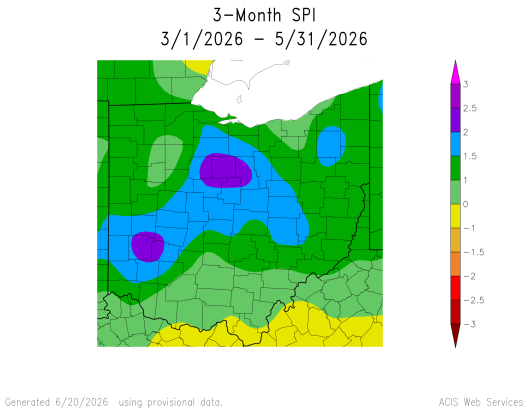
This past spring brought widespread rainfall across Ohio, leaving nearly the entire state with normal to above-normal precipitation. This pattern aligns with the fact that Ohio has experienced no categorical drought over the past three months and, at one point, stood out as one of the only states in the nation without drought conditions. While conditions were generally wetter than normal, localized areas of significant (2 standard deviations above the mean) soil saturation were identified in north-central and southwestern Ohio (Fig. 2).
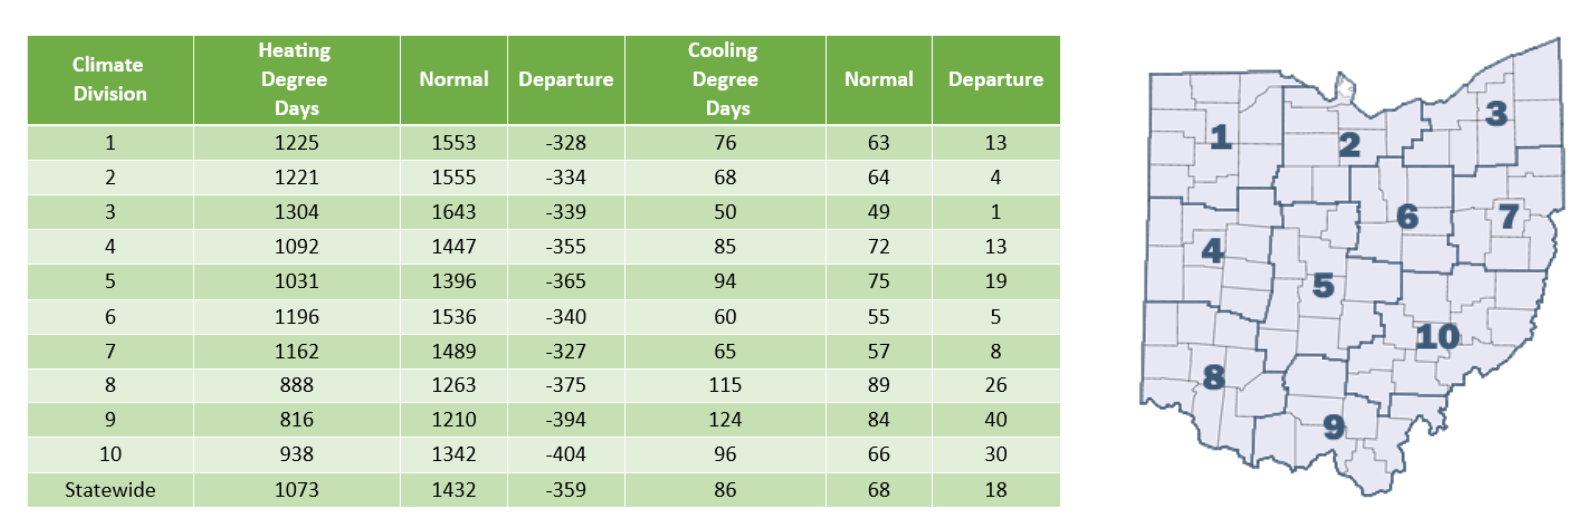
True to the variability of Ohio’s spring weather, heating and cooling needs fluctuated sharply throughout the season. Heating Degree Days (HDDs) were lower than normal, while Cooling Degree Days (CDDs) showed a statewide average departure of 18 above normal. Frequent switching between heating and air conditioning can significantly increase energy use as systems repeatedly power on and off to adjust to rapid temperature swings (Fig. 3).
Looking Ahead
Temperature and precipitation outlooks for the next three months remain uncertain as we move into the summer season. Ohio currently has equal chances of above- or below-normal temperatures (Fig. 4a). However, given early-July trends and the significant early-month heat wave, temperatures are already leaning above normal for this time of year. A similar pattern holds for precipitation, with equal chances of wetter- or drier-than-normal conditions across the state (Fig. 4b).
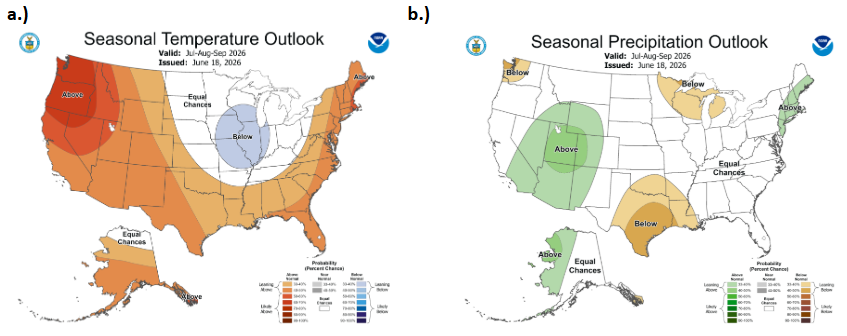
Note: these outlooks do not provide the quantity of above- or below-normal conditions, just the likelihood of occurrence (i.e., the probability).
As July begins, Ohio farmers are seeing strong crop growth across much of the state, along with the start of the wheat harvest. Recent rainfall has boosted soil moisture, leaving both topsoil and subsoil more than 5% above normal, a helpful buffer heading into the upcoming heat. However, as the heat intensifies, this moisture will be gradually depleted through evapotranspiration, potentially placing stress on crops and weakening them if high temperatures persist. Another ongoing challenge has been the number of localized rainfall events that have led to uneven conditions across the state. While some farms benefited from timely downpours, others saw only portions of their fields receive rain from the same storm.
Authors
Alexis Jahnke: Atmospheric Sciences Undergraduate, Student Assistant: Climate Services - Byrd Polar and Climate Research Center, The Ohio State University, jahnke.30@osu.edu
Geddy R. Davis: Meteorologist/Atmospheric Scientist, Program Coordinator: Climate Services - Byrd Polar and Climate Research Center, The Ohio State University, davis.5694@osu.edu
Aaron B. Wilson: State Climate Office of Ohio, Byrd Polar and Climate Research Center & OSU Extension, The Ohio State University, wilson.1010@osu.edu