Monthly Climate Summary: November 2025
Provided by the State Climate Office of Ohio, a collaboration of the Byrd Polar and Climate Research Center, Geography Department, and OSU Extension with support from Energent Solutions.
Subscribe to the Monthly Ohio Climate Summaries and Outlooks
Temperature
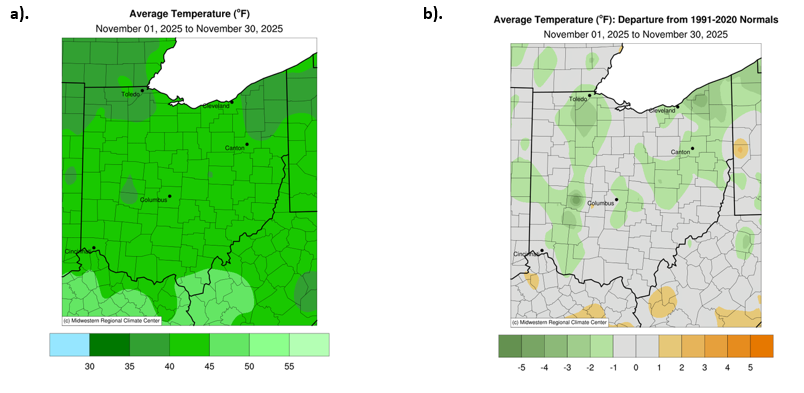
The average temperature across Ohio remained fairly consistent in November, generally ranging from 40 to 45°F. Slightly cooler conditions were observed in both northeast and northwest Ohio, where temperatures ranged from 35 to 40°F, ranked just inside the warmest third (Fig. 1a). When compared to long-term averages, most of the state experienced near-normal temperatures for this time of year. However, several regions scattered throughout Ohio recorded temperatures 1 to 4°F below normal (Fig. 1b).
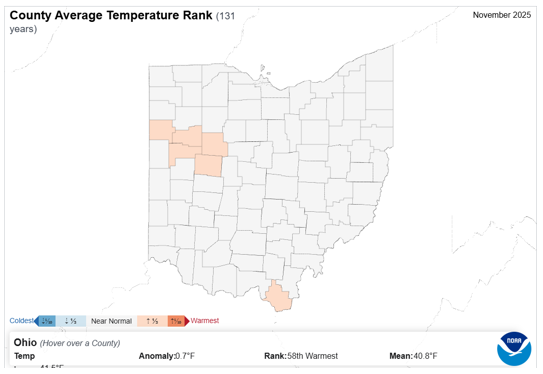
With a mean temperature of 40.8°F, most of Ohio experienced near-normal conditions in November, except several counties in the midwestern portion of the state and the southernmost county (Fig. 2). Lawrence, Van Wert, Allen, Auglaize, Logan, and Hardin counties ranked in the warmest third of their historical November temperature records. Overall, the month ranked as Ohio’s 58th-warmest November on record. Due to two major winter storm systems passing through Ohio at the beginning and end of the month, the colder periods associated with these systems balanced out a notably warmer stretch during mid-November.
Precipitation
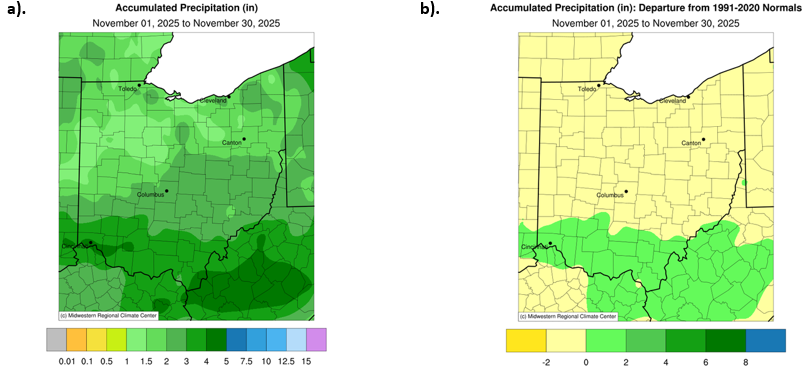
Precipitation in November was heaviest across southern Ohio, where totals reached 3 to 4 inches. Amounts gradually decreased northward, with the lowest values ranging from 1 to 1.5 inches (Fig. 3a). Comparing these lower totals to the departure from normal, most of Ohio received 0 to 2 inches less than normal for the month. Southern portions of the state, however, experienced slightly wetter conditions, with totals running 0 to 2 inches above normal (Fig. 3b).
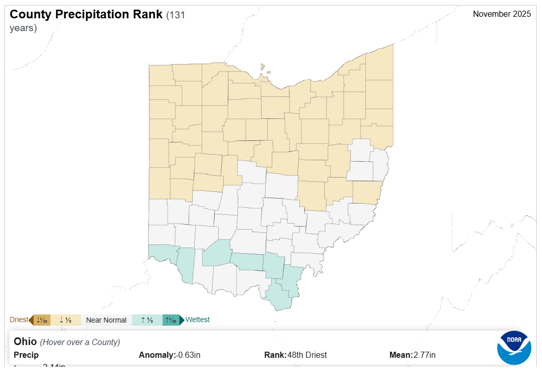
At the county level, the state was effectively divided into thirds. Dry conditions continued to dominate across northern Ohio, while a clear gradient emerged farther south, with near-normal precipitation in central Ohio and wetter-than-normal conditions across the southern tier. The northern third of the state ranked within the driest third of its historical November precipitation records, whereas Hamilton, Clermont, Jackson, Gallia, Highland, Pike, and Lawrence counties ranked within the wettest third (Fig. 4). The statewide mean precipitation was 2.77 inches, making this Ohio’s 48th-driest November on record.
Soil & Energy
Soil moisture patterns at the end of November closely reflected the month’s precipitation totals, with drierthan-normal conditions dominating much of Ohio. Northwest Ohio remained extremely dry at the 0 to 40 cm depth, with soil moisture in the 2 nd percentile. Starting in southwest Ohio, moving diagonally toward the northeast, soils slightly moved up the scale into the 2nd to the 20th percentile. In contrast, normal soil moisture conditions were found only in southeast Ohio, corresponding to the 30th–70th percentile range (Fig. 5a). At deeper levels (0 to 200 cm), the spatial pattern was nearly identical, with the driest soils persisting in the northwest and the wet conditions in the southeast (Fig. 5b).
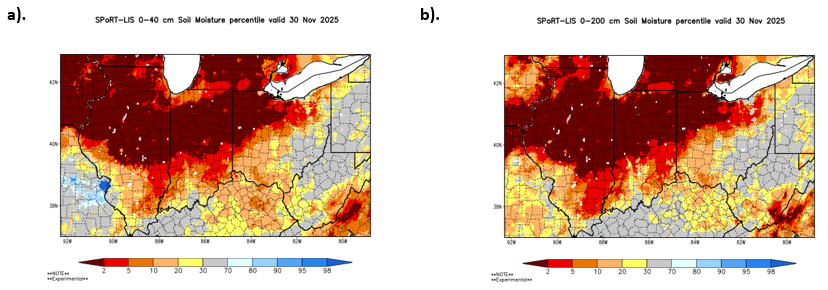
Product Note: Both NASA SPoRT LIS soil moisture products contain small pockets of inaccurate data indicating extremely wet or dry conditions. These small-scale errors can emerge in remote sensing products covering large areas or grid-spacings. For more information, please contact Geddy Davis (davis.5694@osu.edu).
Heating Degree Days (HDDs) and Cooling Degree Days (CDDs) in November showed a clear seasonal shift. The entire state recorded 0 CDDs, indicating that the average daily temperature never rose above 65°F and no cooling demand was needed. In contrast, heating demand was consistent, with the statewide average reaching 701 HDDs (Fig. 6).

Notable Event
Thanksgiving week brought a series of early-season winter weather systems that impacted northwest and northeast Ohio. Impacts began on the Tuesday before Thanksgiving, when the NWS issued high wind advisories for most of Ohio. This was followed by lake effect snow in Northeast Ohio as well as snow squalls in other portions of the state Wednesday through Friday. Finally, a larger system that initially developed in the Rockies pushed into the Midwest on Saturday the 29th, bringing more meaningful snowfall to Northern Ohio. The storm's timing significantly disrupted holiday travel, and moderate to heavy snowfall persisted through Sunday the 30th. Hiram, Ohio, recorded the highest combined totals, topping out at an impressive 15 inches of snow (Fig. 7).

Drought
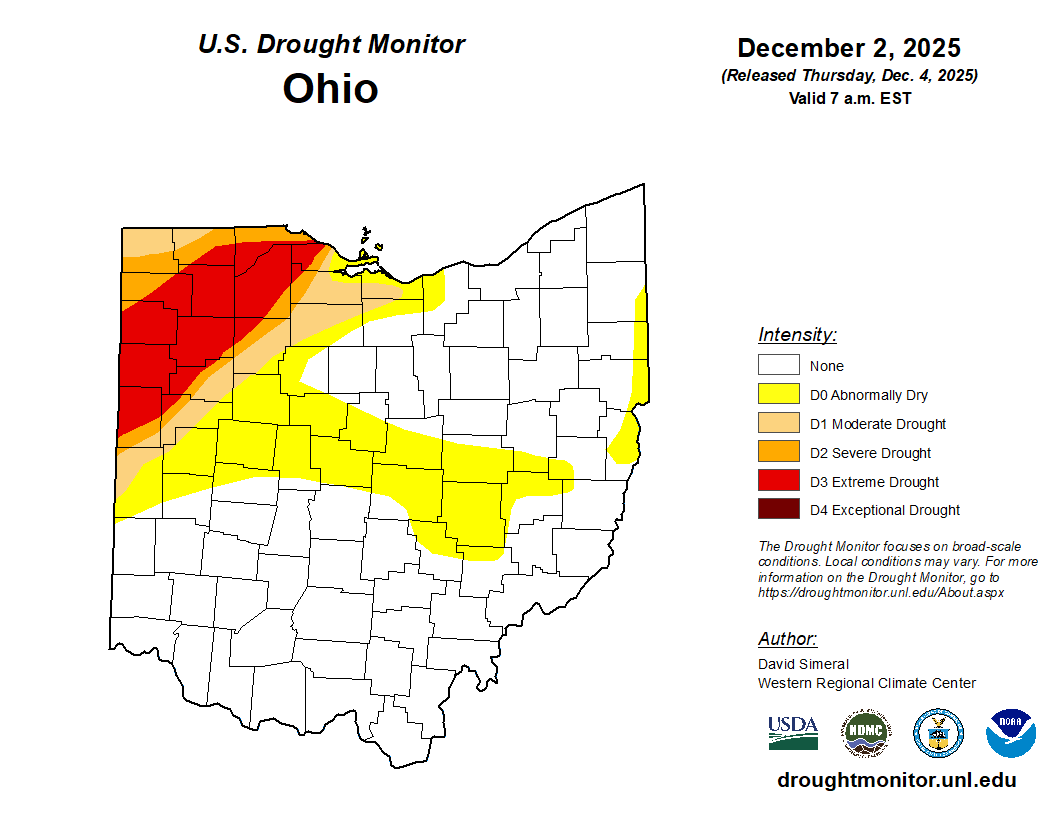
Even with a significant winter storm hitting Ohio in late November, drought conditions continue to grip the northwest part of the state. The most severe impacts remain centered around the Toledo area, where extreme drought persists, gradually easing outward into surrounding counties. In total, 19.38% of the state is in D0, 5.03% in D1, 3.38% in D2, and 8.34% in D3 (Fig. 8). Although the month ended with a major snowstorm, soils in northwest Ohio have been been unable to absorb much moisture from the snowpack, as temperatures have been primarily below freezing
Looking Ahead
With the early arrival of winter conditions, the Climate Prediction Center seasonal outlooks don’t have a definitive indication of whether Ohio will experience warmer or cooler than normal temperatures over the next three months (Fig. 9a). However, the seasonal precipitation outlook suggests that most of the state has a 40 to 50% chance of receiving above normal precipitation. These probabilities decrease slightly along Ohio’s eastern border, where chances fall to 33 to 40% (Fig. 9b).
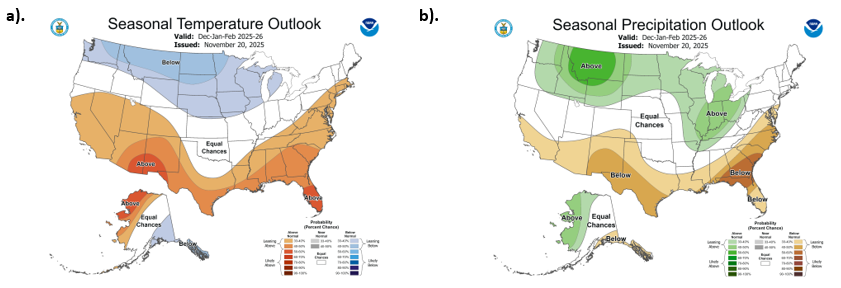
For northwest Ohio, where severe drought conditions persist, this wetter outlook is encouraging for communities, agricultural operations, and water reservoirs that have seen precipitation deficits since August. With an increased likelihood of above-normal precipitation totals throughout the winter months, greater use of road salt, more frequent plowing, and heightened travel impacts could be expected. Additionally, the potential for more winter storm watches, warnings, and lake effect snow events may increase as a result.
Note: these outlooks do not provide the quantity of above or below normal conditions, just the likelihood of occurrence (i.e., the probability).
Authors
Alexis Jahnke: Undergraduate Student, Student Assistant: Climate Services, Byrd Polar and Climate Research Center, The Ohio State University, jahnke.30@osu.edu
Aiden Ridgway: Undergraduate Student, Student Assistant: Climate Services, Byrd Polar and Climate Research Center, The Ohio State University, ridgway.72@osu.edu
Geddy R. Davis: Meteorologist/Atmospheric Scientist, Program Coordinator: Climate Services - Byrd Polar and Climate Research Center, The Ohio State University, davis.5694@osu.edu
Aaron B. Wilson: State Climate Office of Ohio, Byrd Polar and Climate Research Center & OSU Extension, The Ohio State University, wilson.1010@osu.edu
