
Monthly Climate Summary: February 2026
Provided by the State Climate Office of Ohio, a collaboration of the Byrd Polar and Climate Research Center, Geography Department, and OSU Extension with support from Energent Solutions.
Subscribe to the Monthly Ohio Climate Summaries and Outlooks
Temperature
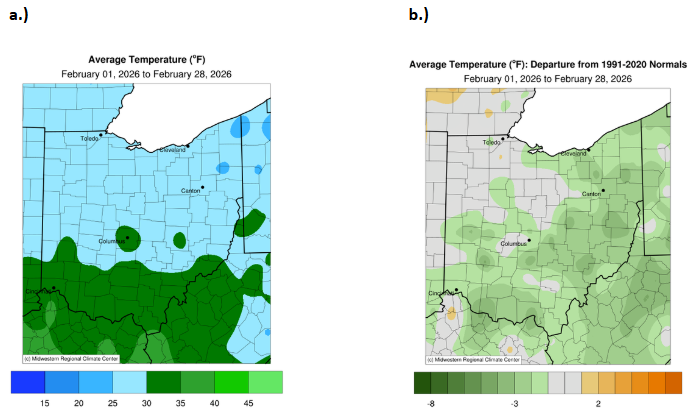
Ohio experienced average temperatures ranging from 20° to 35°F during February. Most of the state recorded averages between 25° and 30°F, while southern Ohio saw slightly warmer conditions, with temperatures between 30° and 35°F. Isolated pockets of 30° to 35°F extended into central Ohio. In contrast, parts of northeastern Ohio were cooler, averaging between 20° and 25°F (Fig. 1a). Compared to historical normals, much of the state was 1° to 4°F below average for this time of year, while northwestern Ohio remained near normal (Fig. 1b).
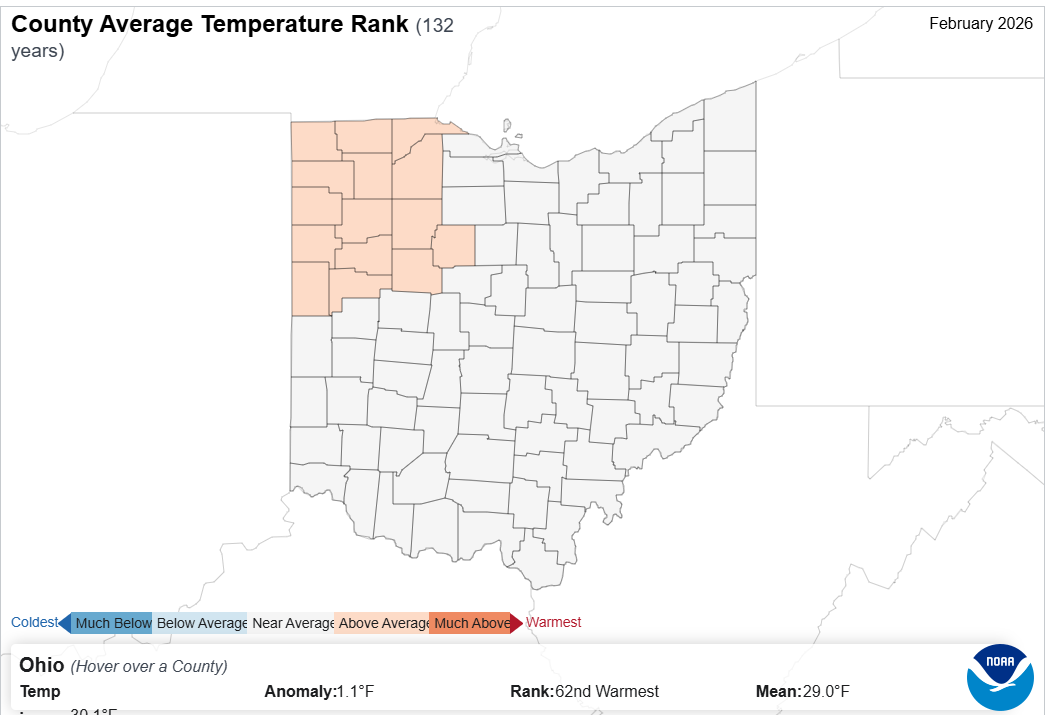
The county average temperature rankings show that most of Ohio experienced near-average temperatures for the month. The main exception was northwest Ohio, where temperatures were above average (Fig. 2). Within the 132-year climate record, this month ranked as the 62nd warmest, with a statewide mean temperature of 29°F.
Precipitation
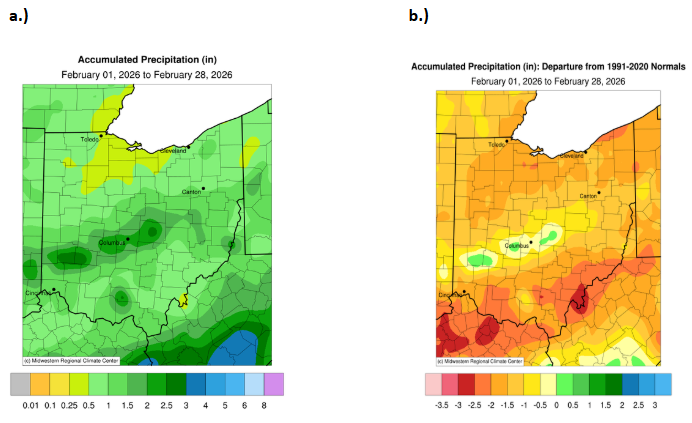
Below-normal precipitation characterized much of Ohio in February, with several areas receiving barely half an inch of total precipitation. Most of the state recorded between 0.5 and 1.5 inches for the month. The driest conditions were observed east of Toledo, where only 0.25 to 0.5 inches fell, while parts of central and west-central Ohio saw higher totals ranging from 1.5 to 3 inches (Fig. 3a). Compared to historical averages, much of Ohio was deficient by as much as 3 inches, resulting in overall below-normal precipitation for February. Small pockets of above-normal precipitation were present in central and west-central Ohio (Fig. 3b).
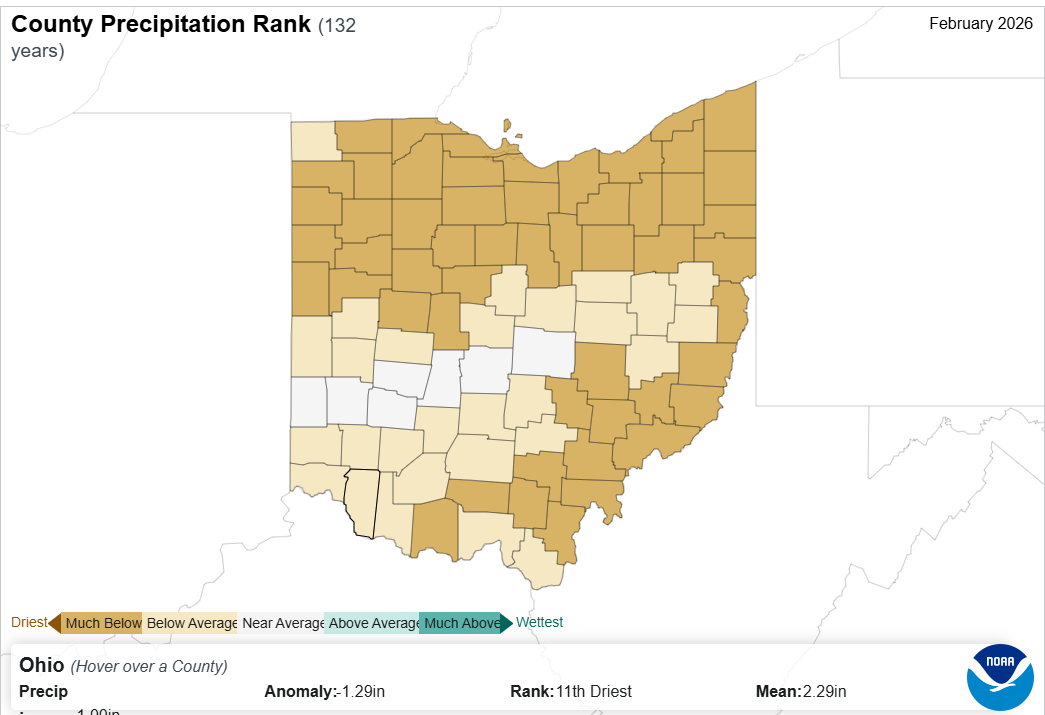
February’s county precipitation rankings indicate that most of Ohio experienced below-average precipitation. The driest conditions were concentrated across the northern half of the state, with a few southern counties also seeing significant deficits. Some central and southwestern counties experienced relatively less severe dryness, providing limited relief from these conditions (Fig. 4). Overall, February ranked as the 11th driest month in the 132-year record, with an average statewide precipitation total of 2.29 inches.
Soil & Energy
Drier soil conditions persisted across northwestern and parts of southwestern Ohio during February. At the 0–40 cm depth, soil moisture percentiles generally ranged from 30% to 70%, indicating near-normal conditions across much of the eastern portion of the state (Fig. 5a). At the deeper 0–200 cm layer, however, dry conditions became more widespread, expanding into central and northeastern Ohio and leaving only limited areas with near-normal soil moisture (Fig. 5b). At both depths, isolated regions fell into the 2nd percentile, indicating areas of severe soil moisture deficit.
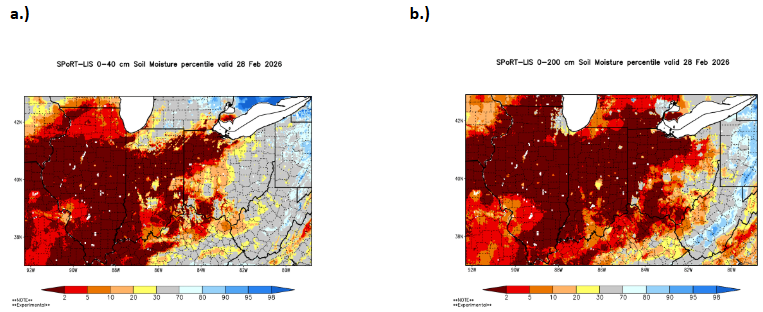
Product Note: Both NASA SPoRT LIS soil moisture products contain small pockets of inaccurate data indicating extremely wet or dry conditions. These small-scale errors can emerge in remote sensing products covering large areas or grid-spacings. For more information, please contact Geddy Davis (davis.5694@osu.edu).
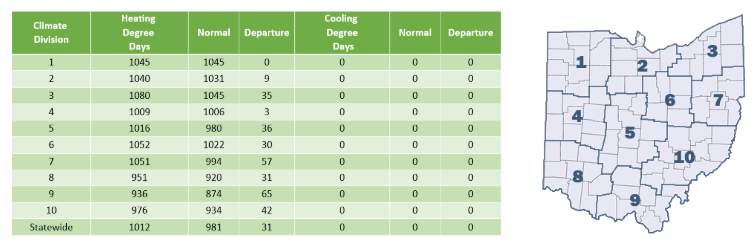
With persistently cool temperatures throughout the month, Cooling Degree Days remained at zero for February. In contrast, Heating Degree Days showed a statewide departure from normal of up to +31, indicating that energy usage was slightly above average for this time of year (Fig. 6). As temperatures begin to fluctuate with the seasonal transition, energy demand may remain elevated during periods when heating and cooling systems are used intermittently.
Notable Event
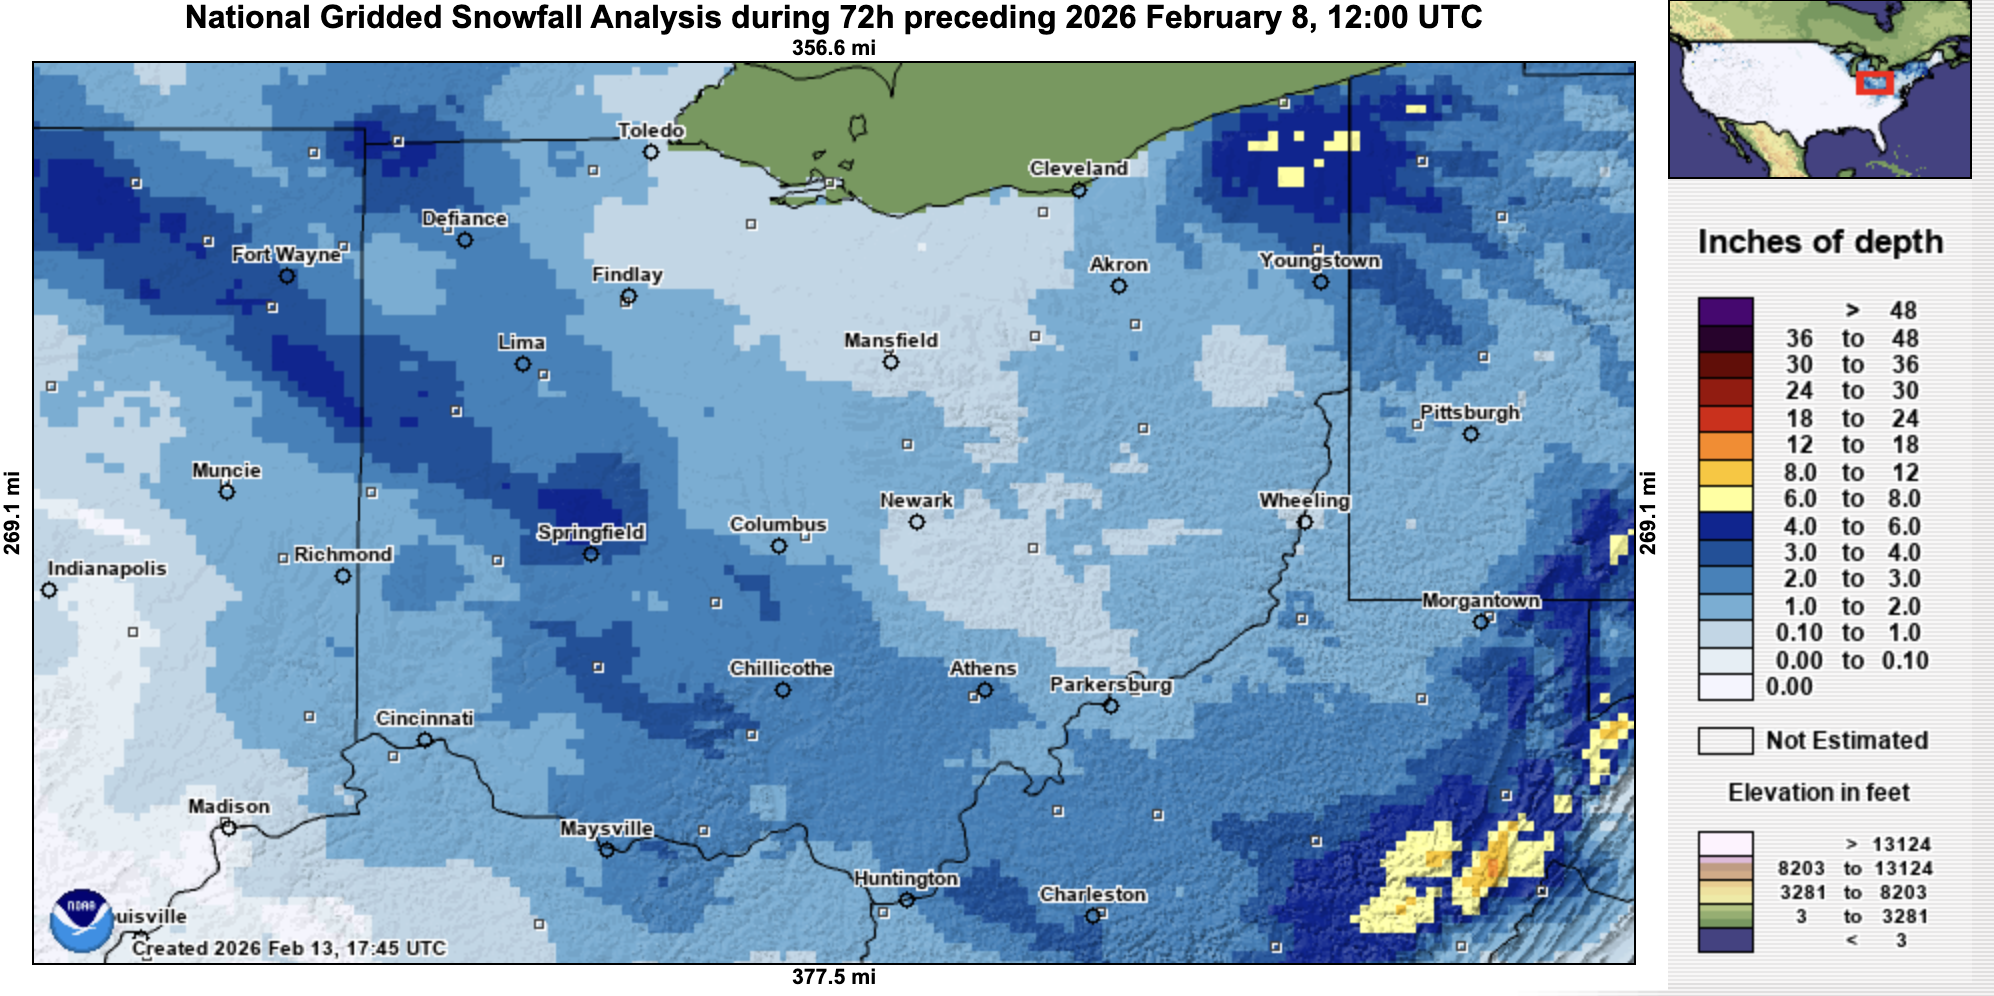
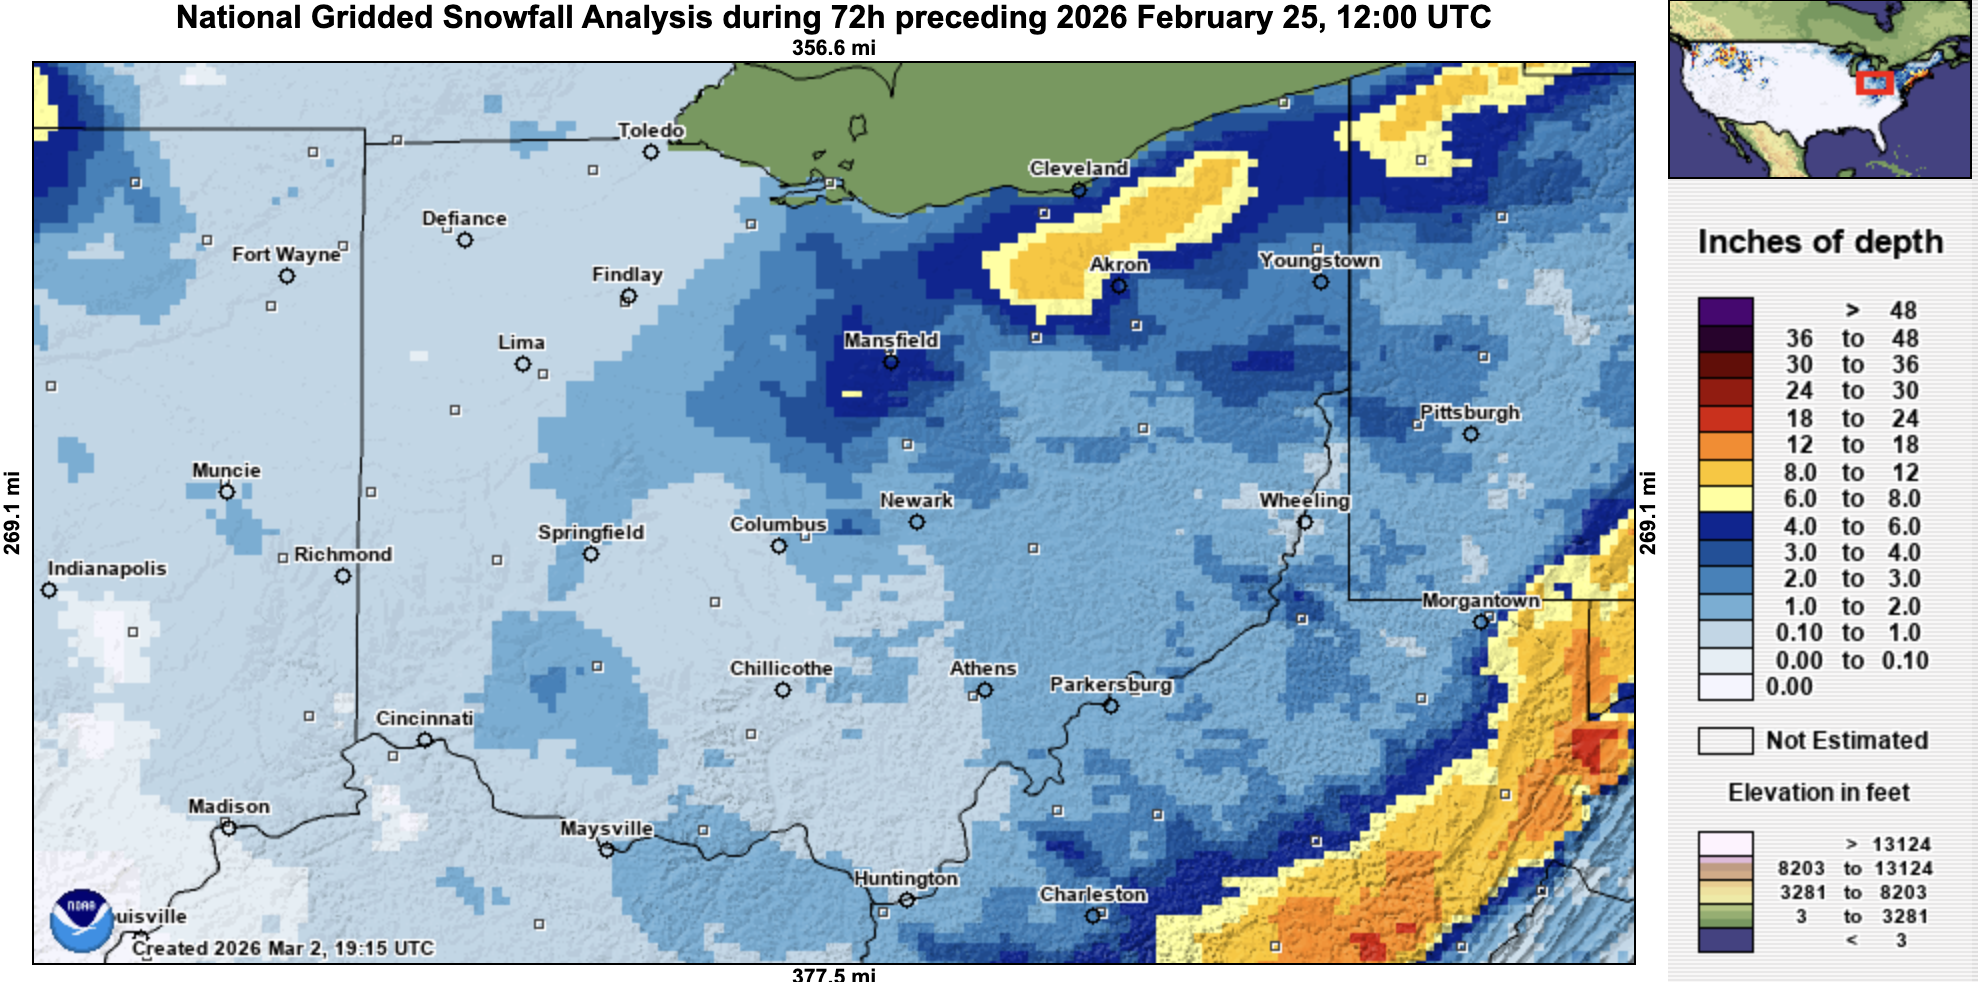
Although February experienced generally lighter precipitation overall, two snowfall events on the 8th and 25th brought notable accumulations to parts of Ohio. By 12 p.m. on February 8, northeastern Ohio and portions of northwestern Ohio had received between 3 and 6 inches of snow, while the rest of the state saw lighter totals of around 1 to 2 inches (Fig. 7). Cold Weather Advisories were issued from February 6–7 as wind chill temperatures between –10°F and –15°F impacted the Columbus, Dayton, and Cincinnati regions. Later in the month, a second system produced greater snowfall totals across northeastern Ohio, where accumulations ranged from 8 to 12 inches. Most other areas of the state received approximately 1 to 3 inches (Fig. 8). A Winter Weather Advisory was issued for northeastern Ohio due to expected lake-effect snowfall and wind gusts up to 35 mph.
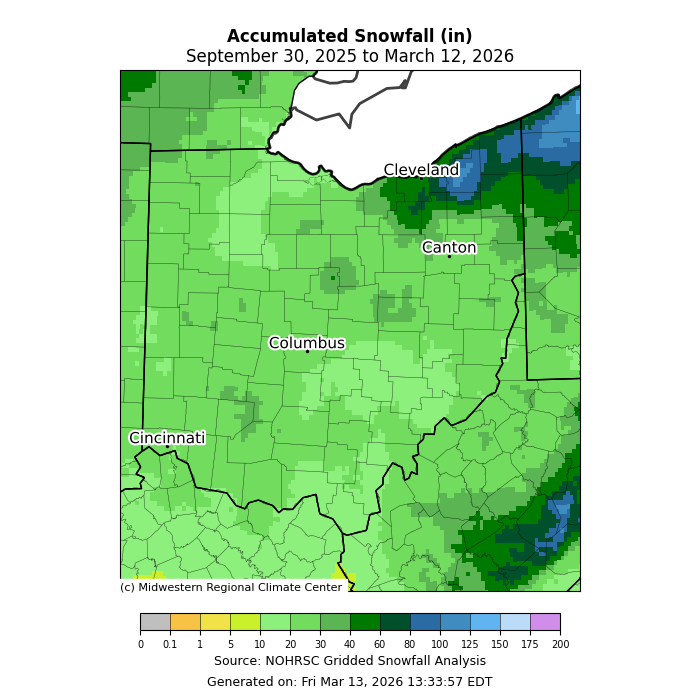
Rounding out the end of winter and moving into spring, finalized snowfall totals for the season can be evaluated. As expected, the snowbelt in northeast Ohio received the highest snowfall amounts due to lake-effect snow. The greatest totals, ranging from 100 to 125 inches, were recorded in Geauga County. Surrounding areas experienced similarly high totals between 60 and 100 inches. Across the rest of Ohio, snowfall amounts were much more uniform, generally ranging from 20 to 30 inches. Although spring is approaching, additional snowfall cannot be ruled out given Ohio’s often variable and unpredictable weather patterns.
Looking Ahead
The Climate Prediction Center has placed Ohio in an area of equal chances for above-, near-, or below-normal temperatures over the next three months (Fig. 9a). In contrast, the seasonal precipitation outlook slightly favors above-normal precipitation across the state and increases the probability that Ohio could experience wetter-than-average conditions through the spring season (Fig. 9b).

As Ohio transitions from winter to spring, temperatures often fluctuate significantly, alternating between late-season cold spells and early bursts of warmth. These swings can influence soil conditions, especially if the ground repeatedly freezes and thaws. Such variability may delay field preparation and early planting, particularly if soils remain saturated or partially frozen. With precipitation leaning above normal and no clear temperature signal, the potential exists for periods of muddy field conditions interspersed with brief warm windows. Current outlooks suggest that this variability is likely to persist in the months ahead.
Note: these outlooks do not provide the quantity of above or below normal conditions, just the likelihood of occurrence (i.e., the probability).
Authors
Alexis Jahnke: Undergraduate Student, Student Assistant: Climate Services, Byrd Polar and Climate Research Center, The Ohio State University, jahnke.30@osu.edu
Aiden Ridgway: Undergraduate Student, Student Assistant: Climate Services, Byrd Polar and Climate Research Center, The Ohio State University, ridgway.72@osu.edu
Geddy R. Davis: Meteorologist/Atmospheric Scientist, Program Coordinator: Climate Services - Byrd Polar and Climate Research Center, The Ohio State University, davis.5694@osu.edu
Aaron B. Wilson: State Climate Office of Ohio, Byrd Polar and Climate Research Center & OSU Extension, The Ohio State University, wilson.1010@osu.edu