Monthly Climate Summary: May 2026
Provided by the State Climate Office of Ohio, a collaboration of the Byrd Polar and Climate Research Center, Geography Department, and OSU Extension with support from Energent Solutions.
Subscribe to the Monthly Ohio Climate Summaries and Outlooks
Temperature
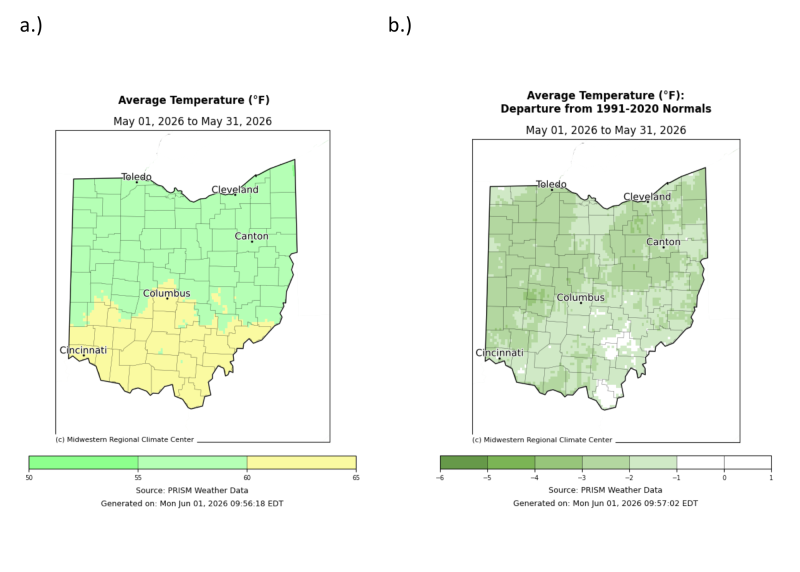
May temperatures across Ohio trended noticeably cooler than what is typically expected for this time of year. Much of central and all of southern Ohio experienced average temperatures in the 60– 65°F range, while northern Ohio and portions of central Ohio remained cooler, averaging 55–60°F (Fig. 1a). Ohio experienced two overnight frosts in this period, May 1-2 and May 11-12, which also contributed to a lower temperature average. Despite a brief mid-month heat wave that affected much of the northeastern United States, the warm spell was neither strong enough nor long-lasting enough to bring statewide monthly averages back to normal. Only a small portion of Ohio, primarily the southernmost counties and areas southeast of Columbus, recorded near-normal temperatures. The remainder of the state finished the month 1– 3°F below normal (Fig. 1b).
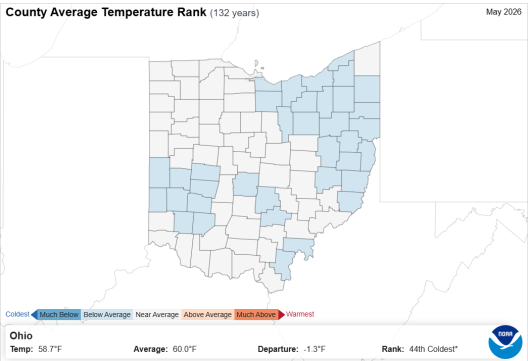
Statewide, this month ranked as the 44th coldest, with an average temperature of 60°F. Northeastern and west-central Ohio experienced below-average temperatures, while the rest of the state remained near average (Fig. 2).
Precipitation
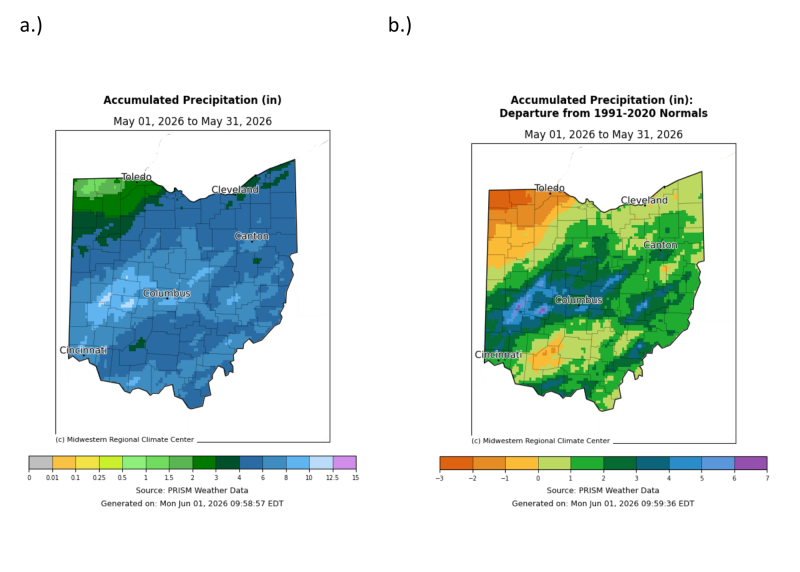
May was a record-setting rainfall month across Ohio, with numerous locations breaking daily precipitation records. Most of the state received 4–6 inches of rain, while areas southwest of Columbus saw exceptionally high totals of 10–12.5 inches. The driest region was northwest Ohio, where monthly precipitation ranged from 1–1.5 inches (Fig. 3a). Compared to climatological normals, these totals left regions west of Columbus with 5–7 inches more rainfall than average, and nearly the entire state finished above or near normal. The only notable exception was northwest Ohio, which recorded up to 3 inches below normal precipitation for the month (Fig. 3b).
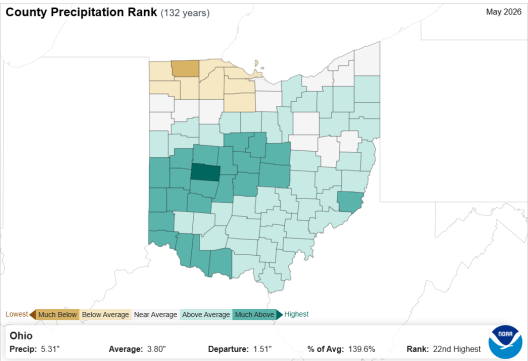
This May, nearly all Ohio counties, aside from portions of the northwest, experienced near-, above-, or much-above-average precipitation. The heaviest rainfall was concentrated across central and west-central Ohio, with one county even reaching record-high totals (Fig. 4). Statewide, May ranked as the 22nd wettest in the 132-year record, with total precipitation reaching 139.6% of the long-term average, or nearly 40% above normal.
Soil & Energy
A late-month snapshot of soil moisture provides insight into conditions across both the 0–40 cm and 0–200 cm layers. In the top 0–40 cm, most of Ohio falls within the normal 30th–70th percentile range, though pockets of extremely dry soils, in the 2nd percentile, are evident in northwest Ohio. Two areas stand out as the most concerning: Defiance and Sandusky counties, which exhibit the driest shallow-soil conditions in the state. Moisture deficits gradually weaken farther east, but dryness still appears along the Lake Erie shoreline in northeast Ohio and across portions of southern Ohio (Fig. 5a). At the 0–200 cm depth, the overall pattern remains similar. However, deeper soils show comparatively wetter conditions across west-central Ohio (Fig. 5b).
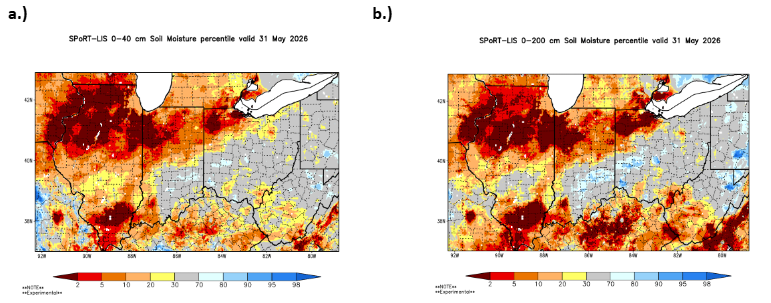
Product Note: Both NASA SPoRT LIS soil moisture products contain small pockets of inaccurate data indicating extremely wet or dry conditions. These small-scale errors can emerge in remote sensing products covering large areas or grid-spacings. For more information, please contact Geddy Davis (davis.5694@osu.edu).
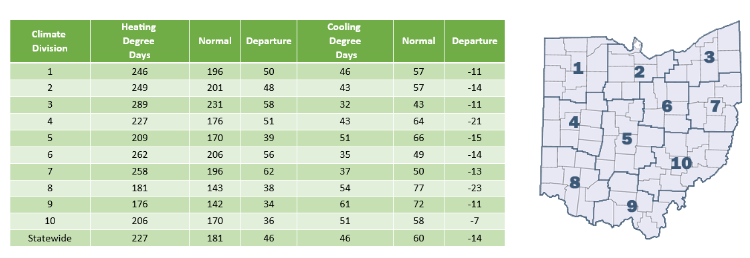
Because May was a cooler-than-average month, Heating Degree Days (HDDs) exceeded Cooling Degree Days (CDDs) across Ohio. The statewide HDD total reached 277, which is 46 above normal. In contrast, CDDs were lower than average, with a statewide value of 60, or 14 below normal (Fig. 6).
Notable Event
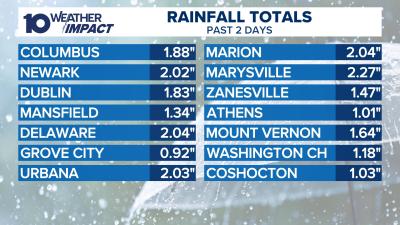
Although severe weather was largely absent in May, rainfall certainly was not, especially across central and southwest Ohio. The most significant event occurred over Memorial Day weekend, when more than two inches of rain fell in many central Ohio towns, with localized areas approaching 3-4 inches (Fig. 7).
During this period, multiple flood watches were issued, followed by flash flood warnings as the heaviest rainfall shifted southeast through central Ohio. Major cities, particularly Columbus, experienced flooded roadways, stranded vehicles, debris, and numerous hydroplaning-related accidents (Fig. 8).

Under typical circumstances, a single event of this magnitude might not produce such widespread impacts. However, Columbus had already recorded measurable precipitation on 18 of the month’s 31 days at John Glenn Columbus International Airport, leaving soils saturated and the water table effectively maxed out (Fig. 9).

As a result, even moderate additional rainfall quickly translated into flooding and runoff issues across the region.
Ohio is not currently experiencing drought conditions, but this spring has shown a pattern that warrants attention. The season has been characterized by intermittent extremes: periods of heavy rainfall followed by extended dry spells lasting one to two weeks. This inconsistency in precipitation means that, despite recent soaking events, quick shifts to drought could become a concern as we move into summer, when evaporation rates increase and soil moisture depletes more quickly.
Looking Ahead
The next three months, as predicted by the Climate Prediction Center, are uncertain regarding what the temperature and precipitation will be in the state of Ohio. The seasonal temperature outlook includes Ohio within the bubble of equal chances of above or below-normal temperatures. However, there is a small sliver of the state, specifically the far southeastern side, that has a 33-40% chance of above-normal temperatures (Fig. 10a ). As for precipitation, Ohio also has equal chances that the upcoming summer months could be wetter or drier than normal (Fig. 10b).
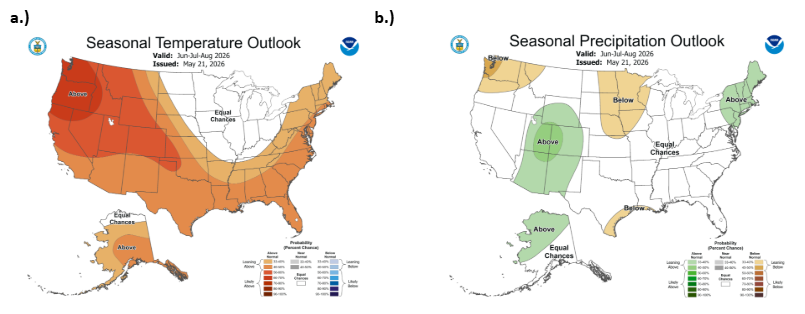
Given the uncertainty in the upcoming months, it will be especially important to monitor newly emerged crops to assess how they respond to fluctuating weather conditions. The heavy rainfall event during the final week of May illustrates how quickly plant health can deteriorate under stress. Excessive moisture can lead to root suffocation, nutrient leaching, soil erosion, and increased susceptibility to mold, all of which can weaken plants, reduce quality, and shorten their lifespan. Note: these outlooks do not provide the quantity of above or below-normal conditions, just the likelihood of occurrence (i.e., the probability).
Authors
Alexis Jahnke: Undergraduate Student, Student Assistant: Climate Services, Byrd Polar and Climate Research Center, The Ohio State University, jahnke.30@osu.edu
Geddy R. Davis: Meteorologist/Atmospheric Scientist, Program Coordinator: Climate Services - Byrd Polar and Climate Research Center, The Ohio State University, davis.5694@osu.edu
Aaron B. Wilson: State Climate Office of Ohio, Byrd Polar and Climate Research Center & OSU Extension, The Ohio State University, wilson.1010@osu.edu