
Seasonal Climate Summary: Winter (December 2025 - February 2026)
Provided by the State Climate Office of Ohio, a collaboration of the Byrd Polar and Climate Research Center, Geography Department, and OSU Extension with support from Energent Solutions.
Temperature and Precipitation
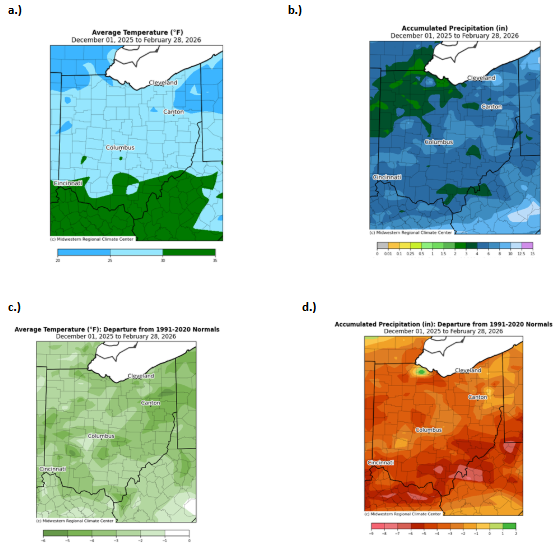
Ohio’s 2025–26 winter was characterized by colder-than-normal temperatures and generally dry conditions. Average temperatures across most of the state ranged from 25°F to 30°F. Slightly warmer conditions, between 30°F and 35°F, were observed in southern Ohio, while the coldest temperature, ranging from 20°F to 25°F, occurred in the northwest and northeast regions (Fig. 1a). Overall, temperatures were approximately 1°F to 5°F below normal statewide (Fig. 1b). Winter precipitation totals were also below average. Most of Ohio received between 6 and 8 inches of precipitation, much of which fell as snow. However, northwest Ohio saw only 2 to 4 inches over the three-month period, providing little relief to ongoing drought conditions (Fig. 1c). Compared to historical averages, nearly the entire state experienced a precipitation deficit of at least 1 inch, with southern Ohio falling short by as much as 7 inches (Fig. 1d). The combination of belownormal temperatures and widespread precipitation deficit, despite record breaking snowfall events, resulted in a cold, dry winter across Ohio.
Soil and Energy
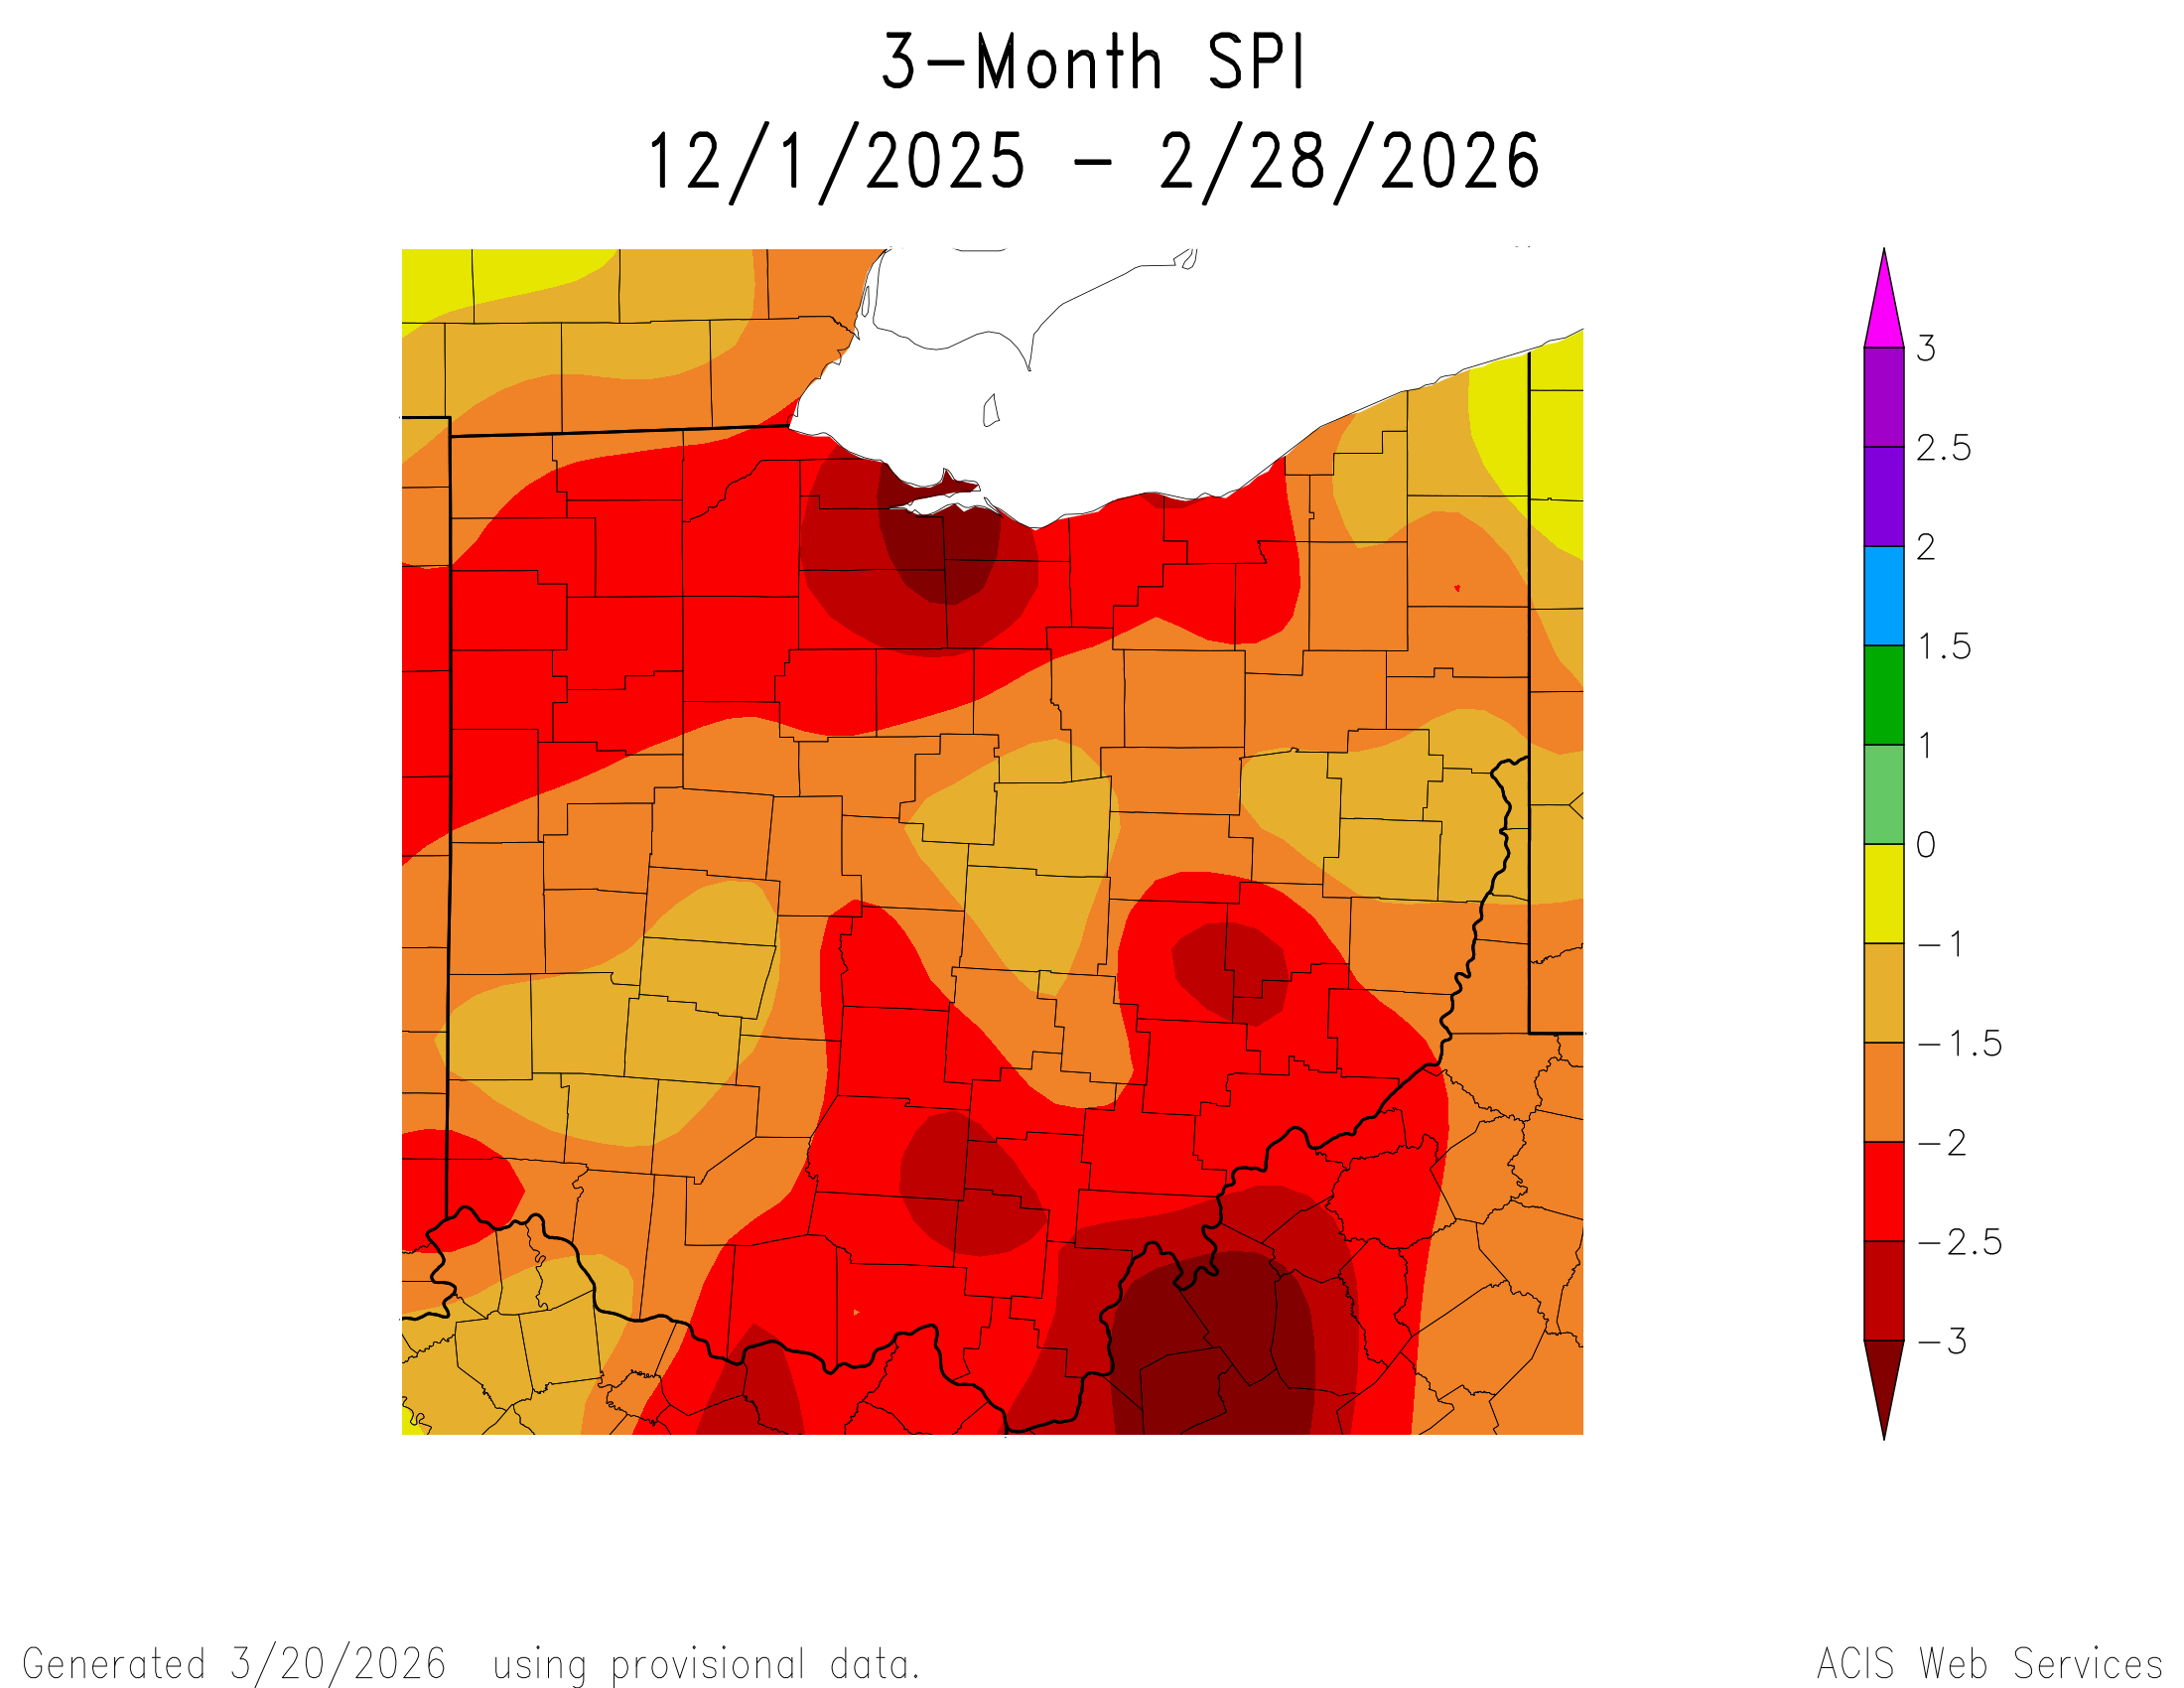
Widespread negative SPI values were present throughout winter, indicating relatively dry soils across Ohio. However, the severity of dryness varied across the state. The driest conditions were concentrated in northwest Ohio, particularly around the Sandusky and Port Clinton areas, where SPIs were exceptionally low. Additional areas of pronounced dryness were present in southern and east-central Ohio (Fig. 2).
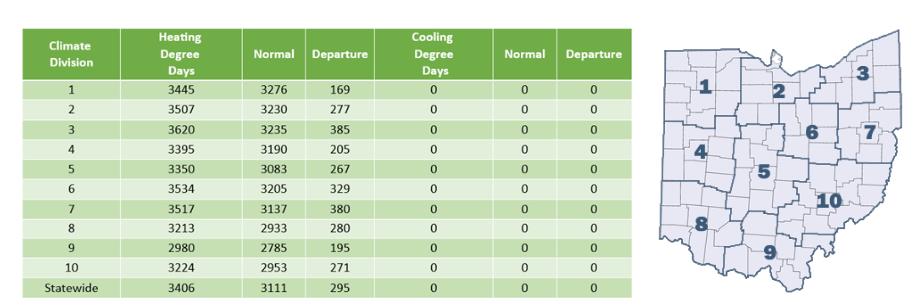
Cooling Degree Days (CDDs) remained at 0 over the past three months, indicating that daily average temperatures did not exceed 65°F. In contrast, Heating Degree Days (HDDs) were elevated. Statewide, a total of 3,406 HDDs were recorded, which is 295 more than the seasonal average. While higher HDD totals are typical during the winter months, this positive departure suggests an increased demand for heating energy during the season, which is consistent with the average temperatures being significantly colder than normal (Fig. 3)
Looking Ahead
After a drier and colder-than-normal winter, what can Ohio expect for the spring three-month temperature and precipitation outlook? The seasonal temperature forecast shows no clear trend toward warmer or cooler conditions, with equal chances for either to occur (Fig. 4a). Precipitation, however, looks more promising. The Climate Prediction Center places Ohio in a region leaning toward above-normal precipitation (Fig. 4b). With increased precipitation activity already recorded in March, northwestern Ohio may see some relief from the ongoing drought conditions.
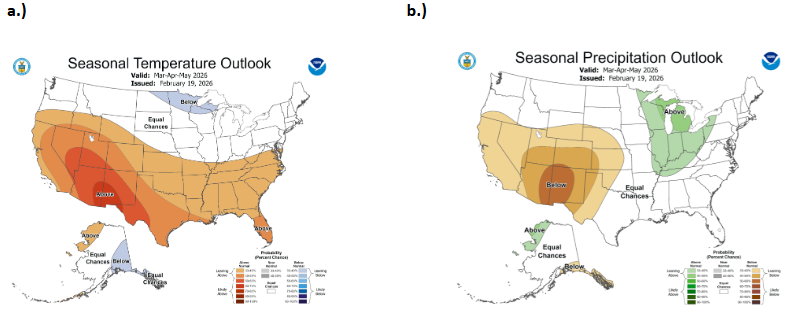
Note: these outlooks do not provide the quantity of above or below normal conditions, just the likelihood of occurrence (i.e., the probability).
The transition from winter to spring is a critical period for planning crop planting. Planting too early can expose seeds and young seedlings to late-season frosts, which can damage or kill them. Excessive rainfall during this time can also cause soil runoff or seed washout. Planting too late, on the other hand, may shorten the growing season, preventing crops from reaching full maturity and potentially reducing overall yield. Paying attention to the weather forecast this spring is going to be crucial in maximizing crop yield and strength.
Authors
Aiden Ridgway: Atmospheric Sciences Undergraduate, Student Assistant: Climate Services - Byrd Polar and Climate Research Center, The Ohio State University, ridgway.72@osu.edu
Alexis Jahnke: Atmospheric Sciences Undergraduate, Student Assistant: Climate Services - Byrd Polar and Climate Research Center, The Ohio State University, jahnke.30@osu.edu
Geddy R. Davis: Meteorologist/Atmospheric Scientist, Program Coordinator: Climate Services - Byrd Polar and Climate Research Center, The Ohio State University, davis.5694@osu.edu
Aaron B. Wilson: State Climate Office of Ohio, Byrd Polar and Climate Research Center & OSU Extension, The Ohio State University, wilson.1010@osu.edu