Monthly Climate Summary: September 2026
Provided by the State Climate Office of Ohio, a collaboration of the Byrd Polar and Climate Research Center, Geography Department, and OSU Extension with support from Power A Clean Future Ohio

Subscribe to the Monthly Ohio Climate Summaries and Outlooks
Temperature
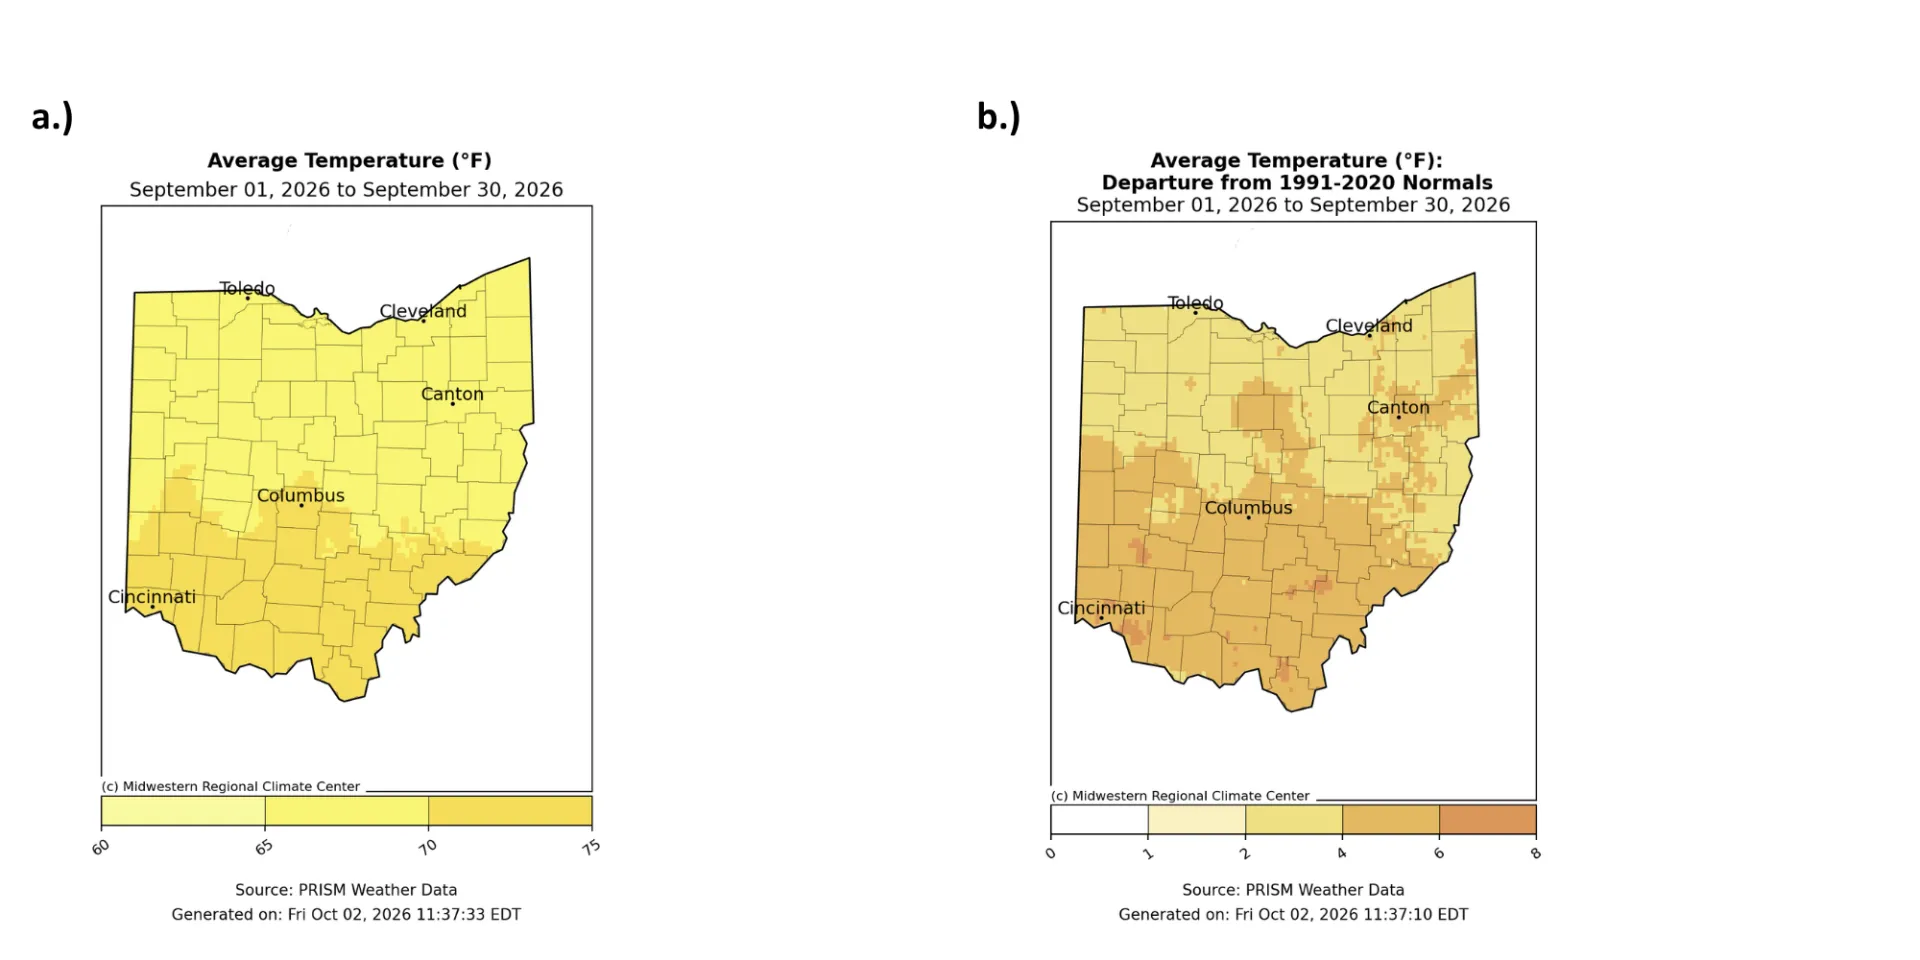
September temperatures across Ohio created a distinct north– south split, with warmer conditions in the southern half of the state and cooler conditions to the north. From Columbus southward, average temperatures ranged from 70–75°F, while areas north of Columbus averaged between 65–70°F (Fig. 1a). Historically, all of these values were above normal for September. The largest departures were 6–8°F above normal and in localized pockets of southern Ohio. Much of the southern half of the state experienced temperatures 4–6°F above normal, whereas the northern half generally saw smaller anomalies of 2–4°F above normal (Fig. 1b).
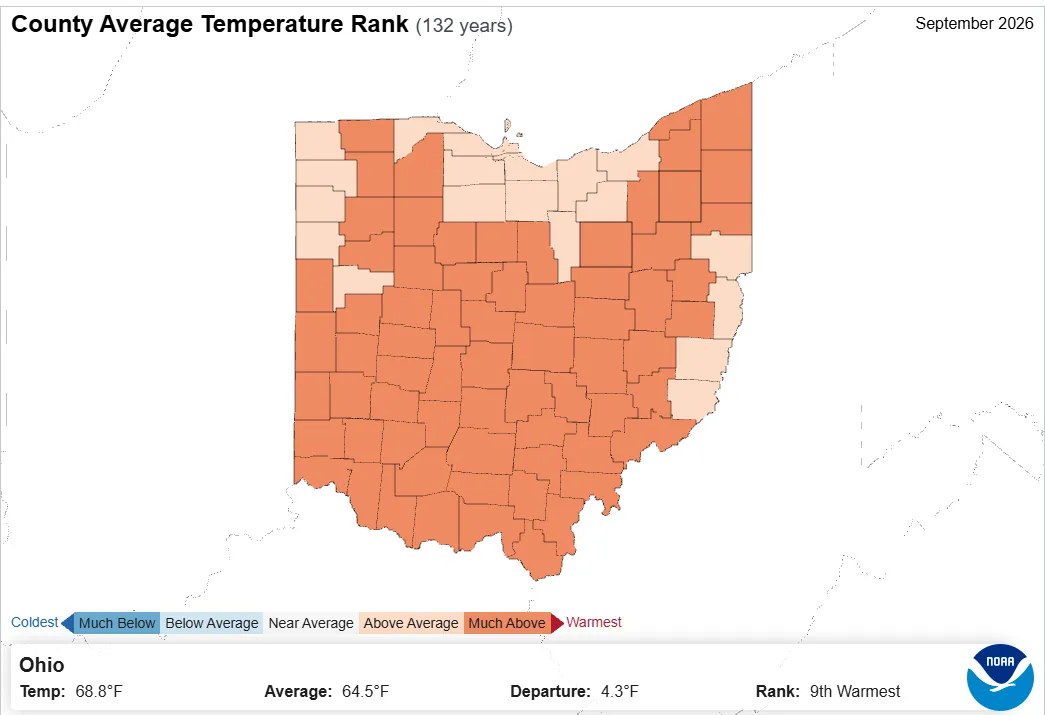
All 88 counties in Ohio recorded above-normal temperatures this month, with most falling into the “much above average” category. The statewide average temperature was 68.8°F, representing a +4.3°F departure from normal. This ranks September as the 9th-warmest on record (Fig. 2).
Precipitation
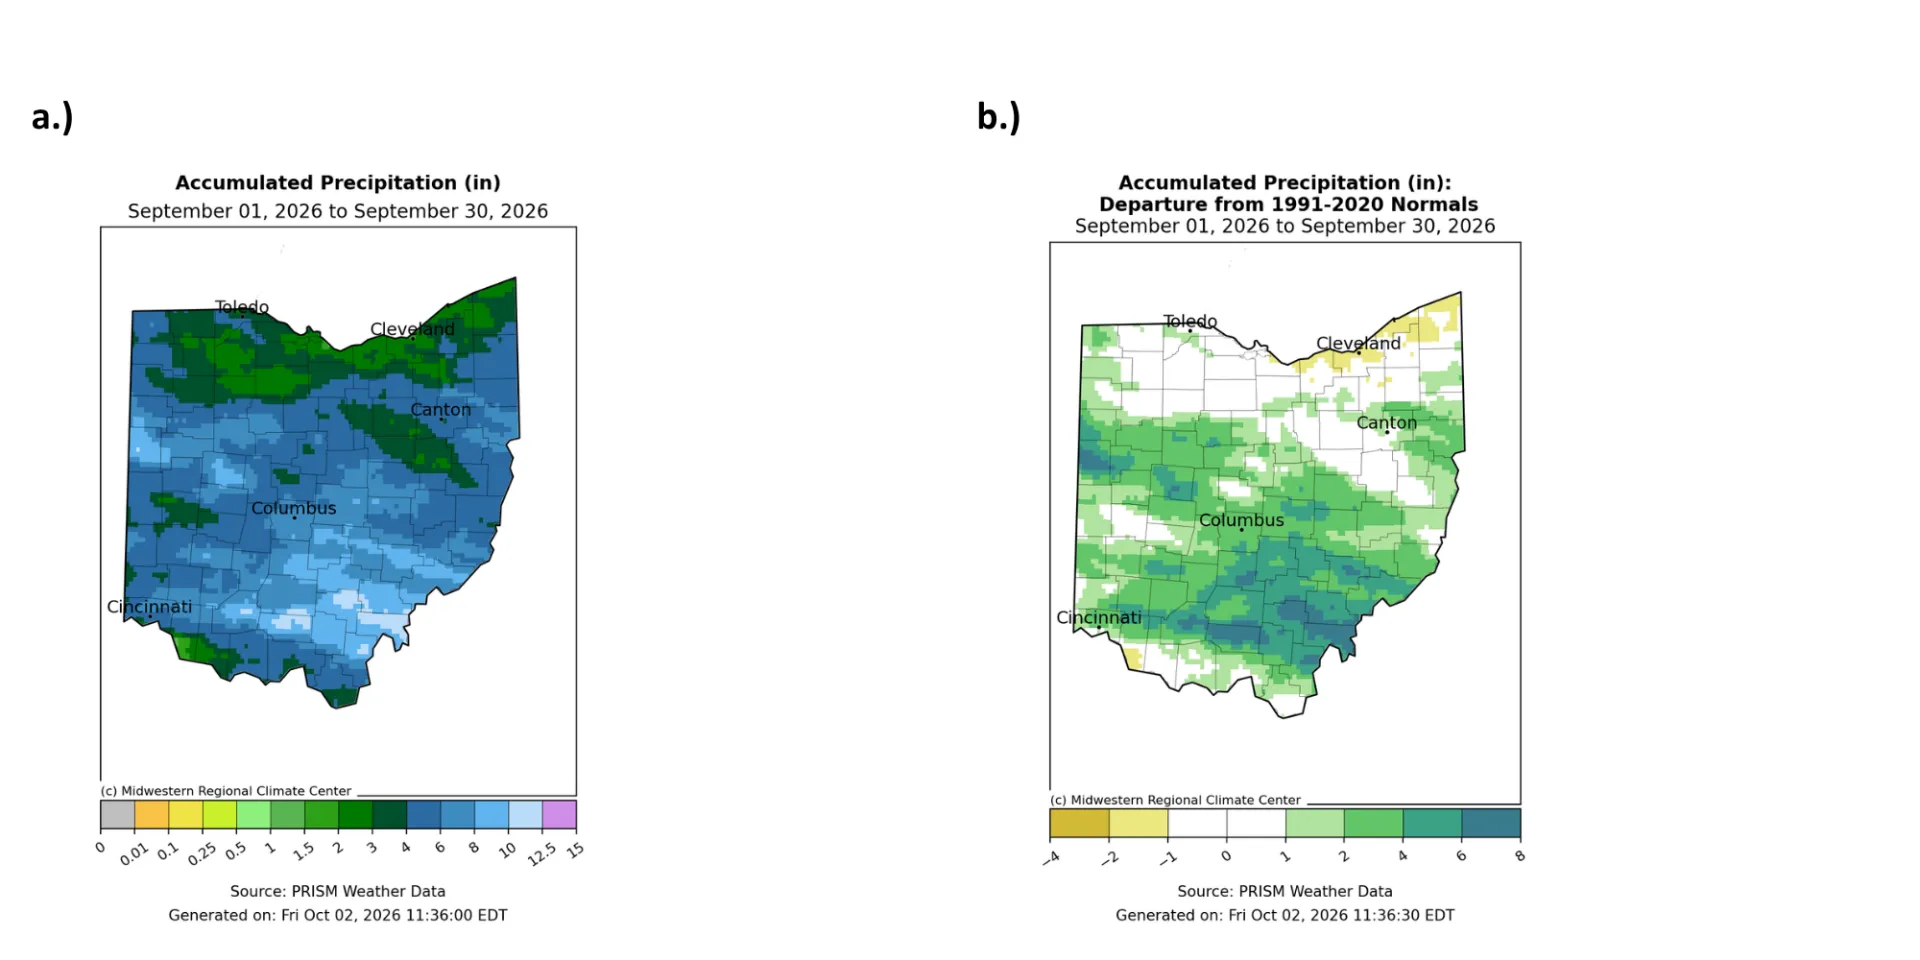
September’s precipitation pattern showed no sign of slowing down after August, with widespread rainfall persisting across the state. Southeastern Ohio emerged as the wettest region, accumulating 10–12.5 inches of rain, with surrounding areas recording 4–8 inches. Northern Ohio remained comparatively dry, with totals closer to 2–4 inches (Fig. 3a). The substantial rainfall in the southeast pushed precipitation departures to 6–8 inches above normal, with neighboring areas also experiencing above-normal conditions. The only region with below-normal precipitation by one inch was northeastern Ohio, which is now the only part of the state currently classified as abnormally dry (Fig. 3b).
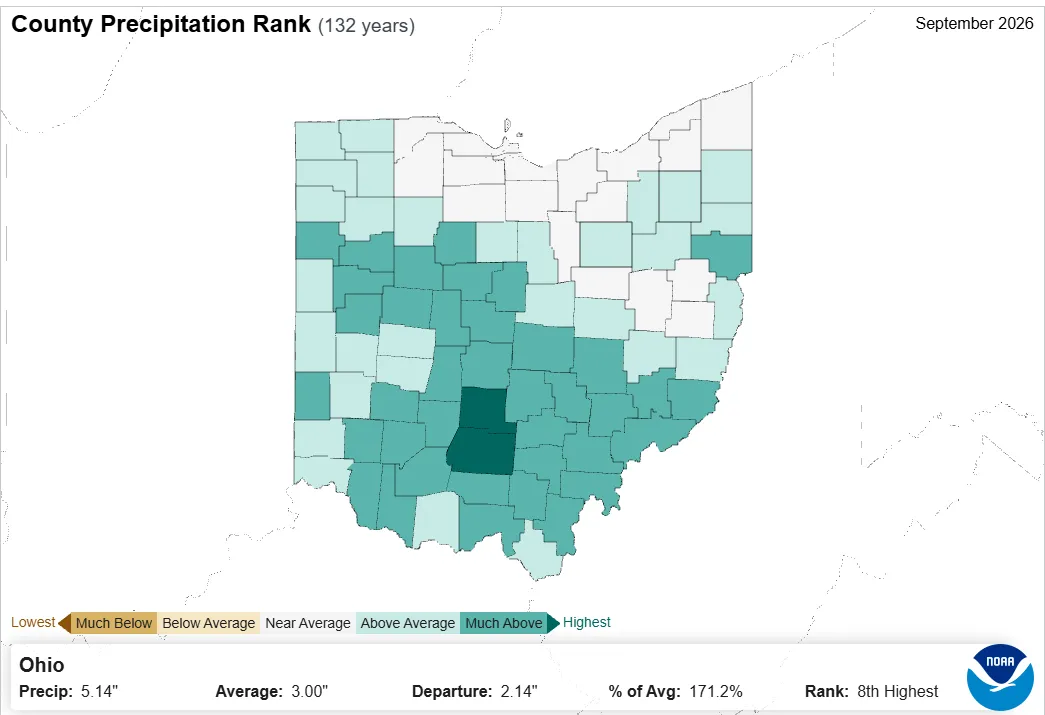
Precipitation totals this month left no counties below average, with most recording above-normal rainfall. North-central and northeastern Ohio experienced near-average conditions, while central and southern counties were much above average, including the highest monthly totals observed in Pickaway and Ross Counties. Statewide precipitation averaged 5.14 inches, 2.14 inches above normal, ranking this September as the 8th-wettest on record (Fig. 4).
Soil & Energy
Soil moisture patterns closely mirror this month’s precipitation distribution. The diagonal swath across Ohio exhibits the wettest topsoil conditions, with values at least 10% above normal. In contrast, the northernmost and southernmost portions of the state show deficits of 20% or more, indicating notably drier surface conditions. A small area in the northeast has the driest soils within - 50~-40% and is also the only area in Ohio experiencing abnormally dry soil conditions (Fig. 5a). Subsoil moisture follows the same general pattern, but with less pronounced extremes, with the wettest areas reaching the top 30% and the driest falling near the bottom 10% (Fig. 5b). Due to the amount of precipitation received this month, no areas for both subsoil and topsoil were below 60% in soil moisture.
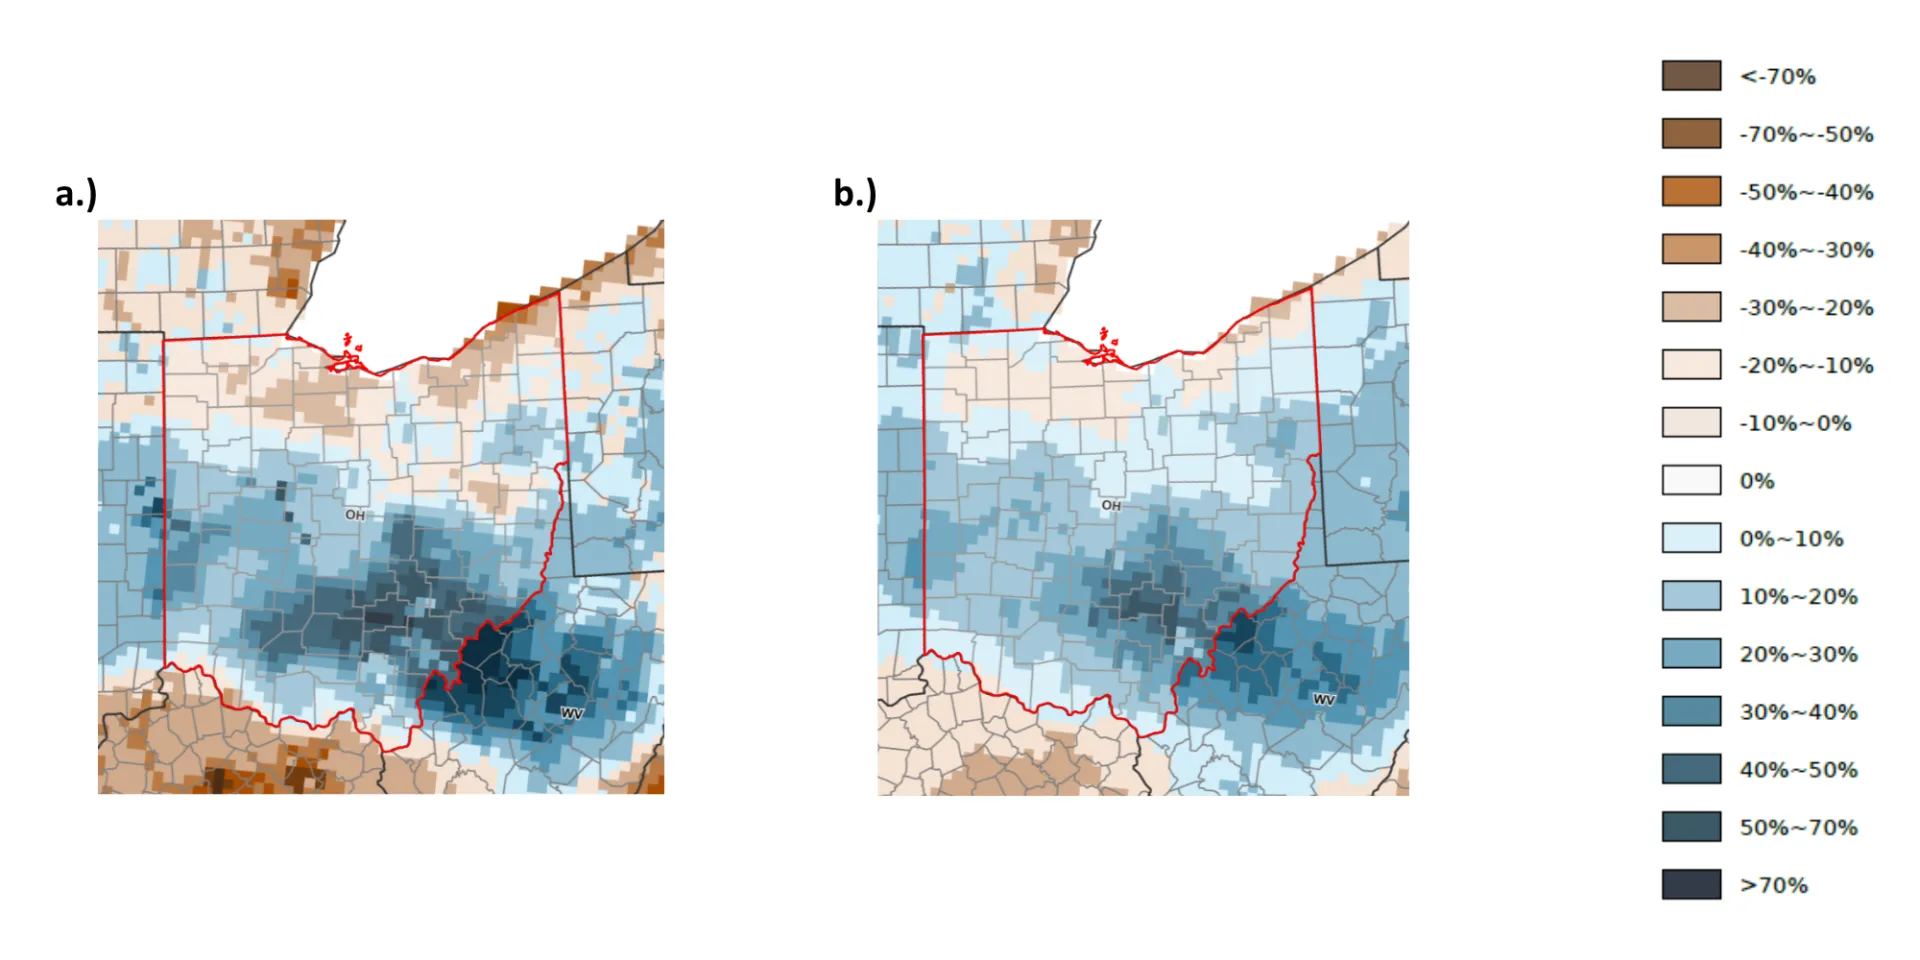
Product Note: Both NASA SPoRT LIS soil moisture products contain small pockets of inaccurate data indicating extremely wet or dry conditions. These small-scale errors can emerge in remote sensing products covering large areas or grid-spacings. For more information, please contact Geddy Davis (davis.5694@osu.edu).
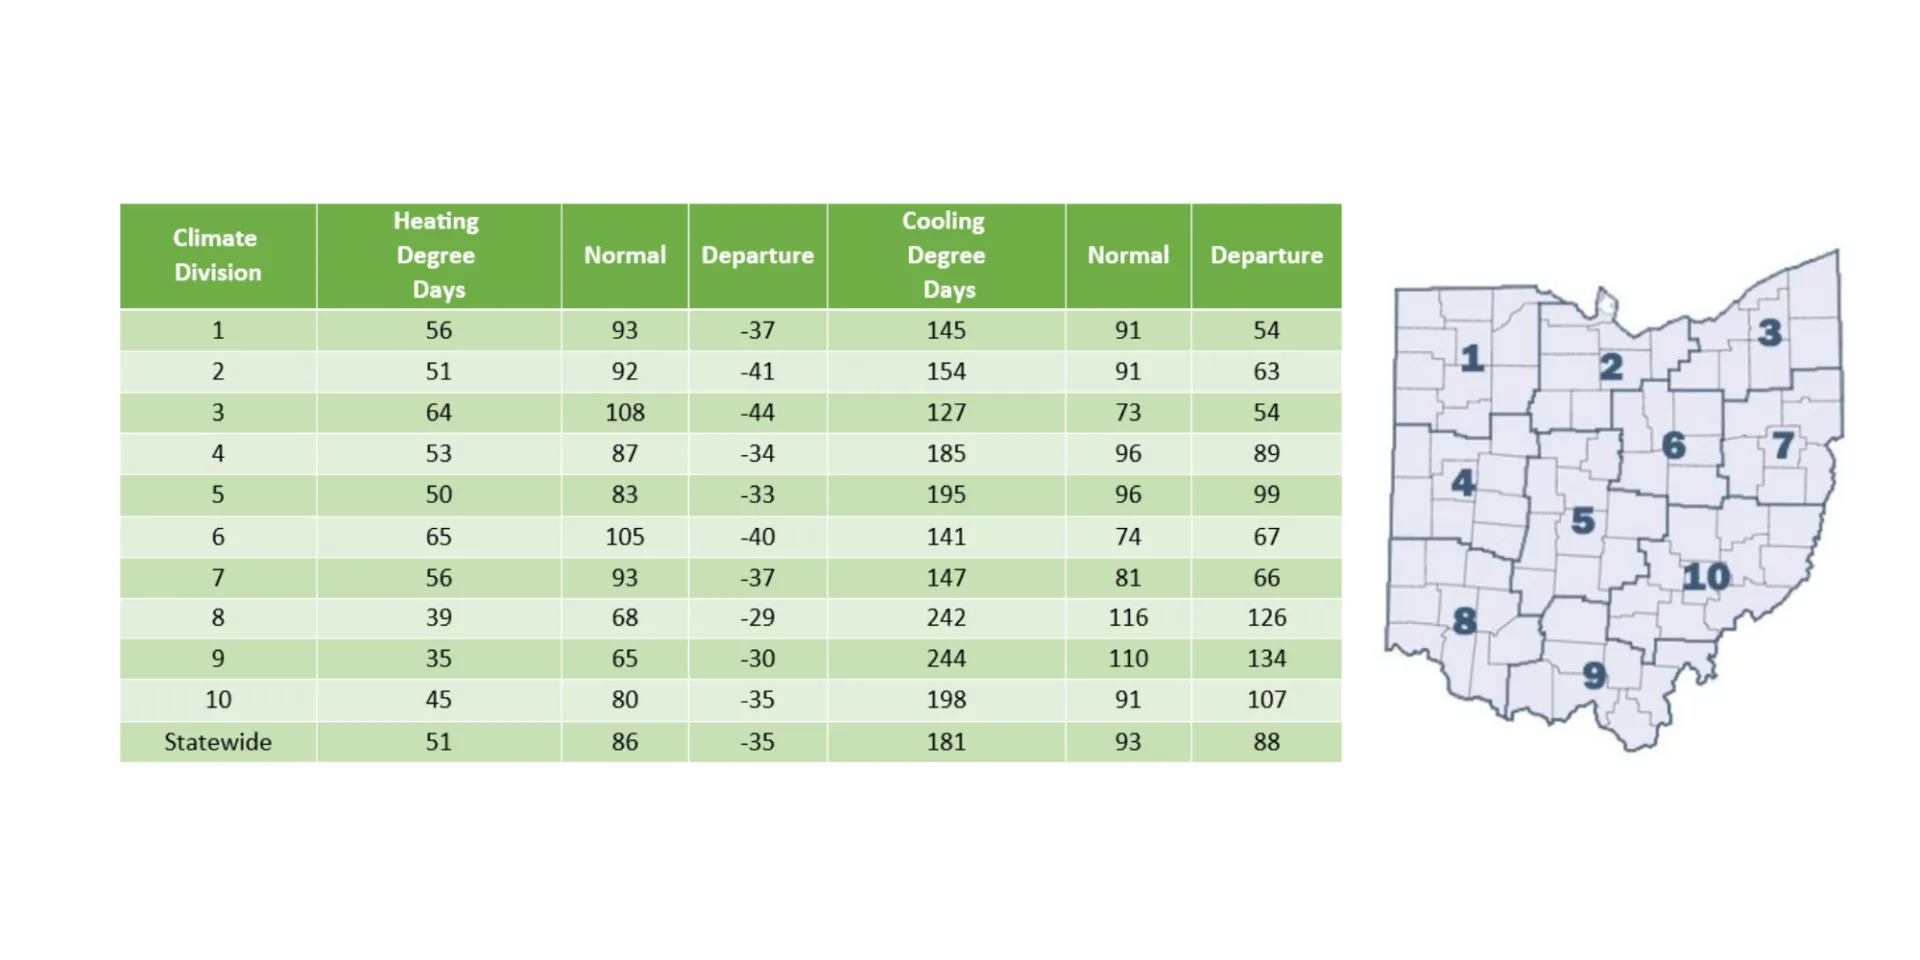
Cooling Degree Days (CDDs) and Heating Degree Days (HDDs) remain close to normal for the month of September. CDDs were slightly above normal while HDDs were slightly below normal (Fig. 6). Although temperatures for the month were above normal, overnight lows allowed for cooler air to enter buildings and reduce the amount of cooling energy needed.
Notable Event
As noted earlier, southeastern Ohio recorded the highest precipitation totals for the month, with two significant flooding events contributing heavily. The first occurred on September 10, when a 500-year rainfall event impacted Jackson, Ohio, producing 5.84 inches of rain in just five hours. Surrounding areas in Meigs and Gallia Counties also received 5–7 inches during the same period (Fig. 7).
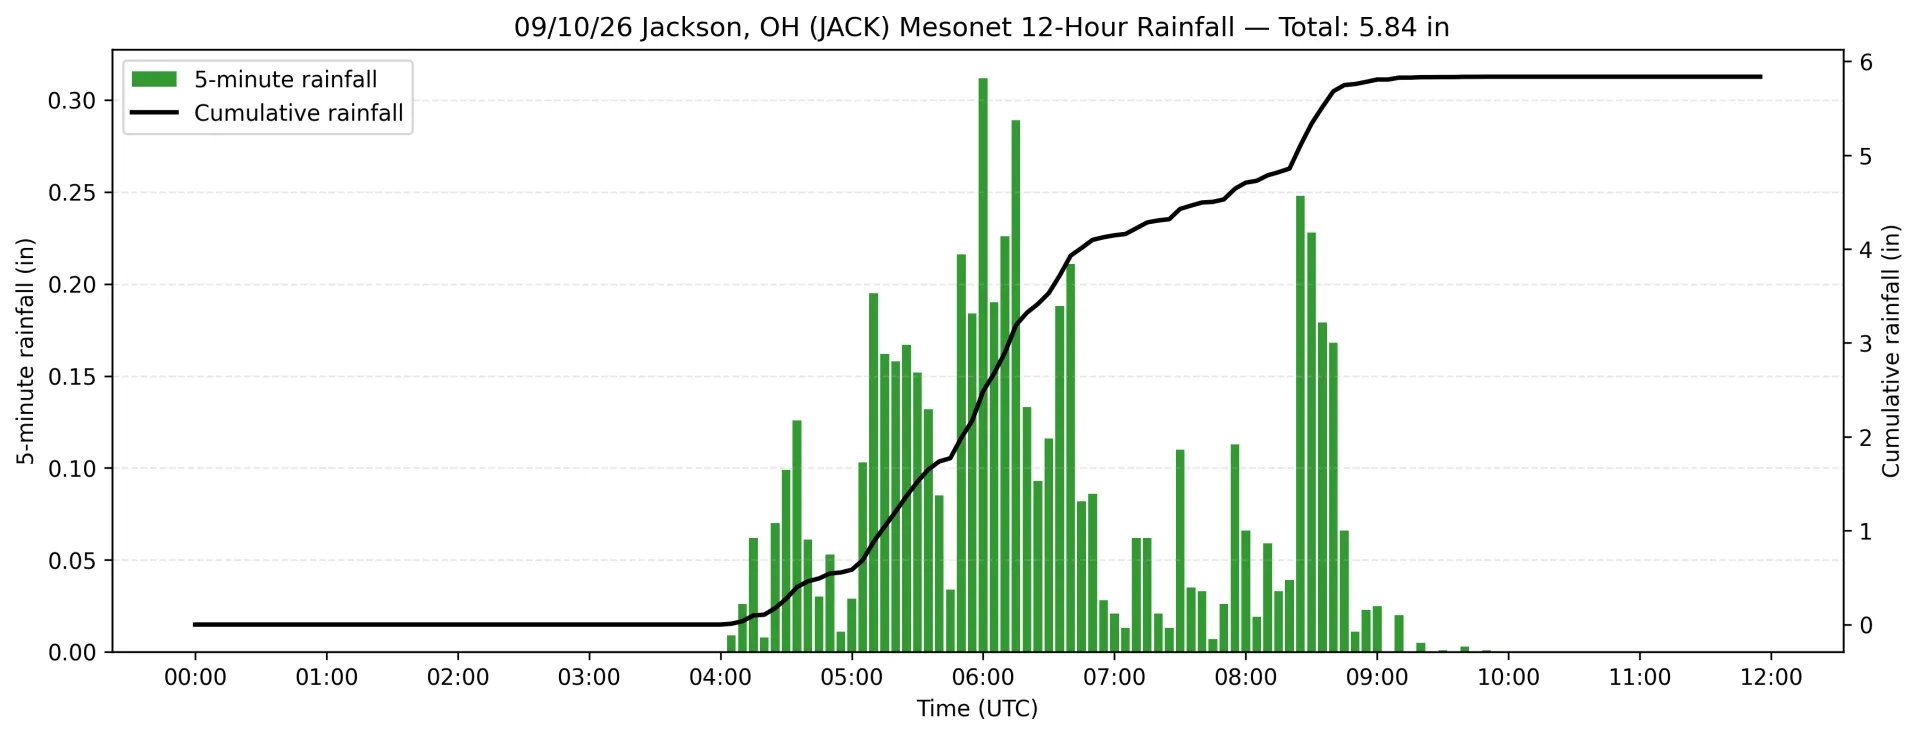
This rainfall triggered flash-flood warnings and required immediate emergency response. Between 4 a.m. and 9 a.m., rising water prompted early-morning evacuations, rescue operations, and widespread disruptions (Fig. 8).

Drone imagery captured during the event shows extensive flooding across small towns, with additional impacts to parks and elementary schools not pictured (Fig. 9).

A second flooding event followed on September 20. After continuous rainfall from Saturday evening into Sunday morning, early-morning evacuations and flash-flood warnings were again issued. Impacts were concentrated in Hocking County, Pickaway County, and Ross County in south-central Ohio. The common denominator between both events was their timing. Early-morning severe weather poses heightened risk because most residents are still asleep, and limited visibility before sunrise makes rising water difficult to detect from a distance. Maintaining charged cellular devices with audible alert settings is an essential safety measure, ensuring that flash-flood warnings are received immediately when issued.
Looking Ahead
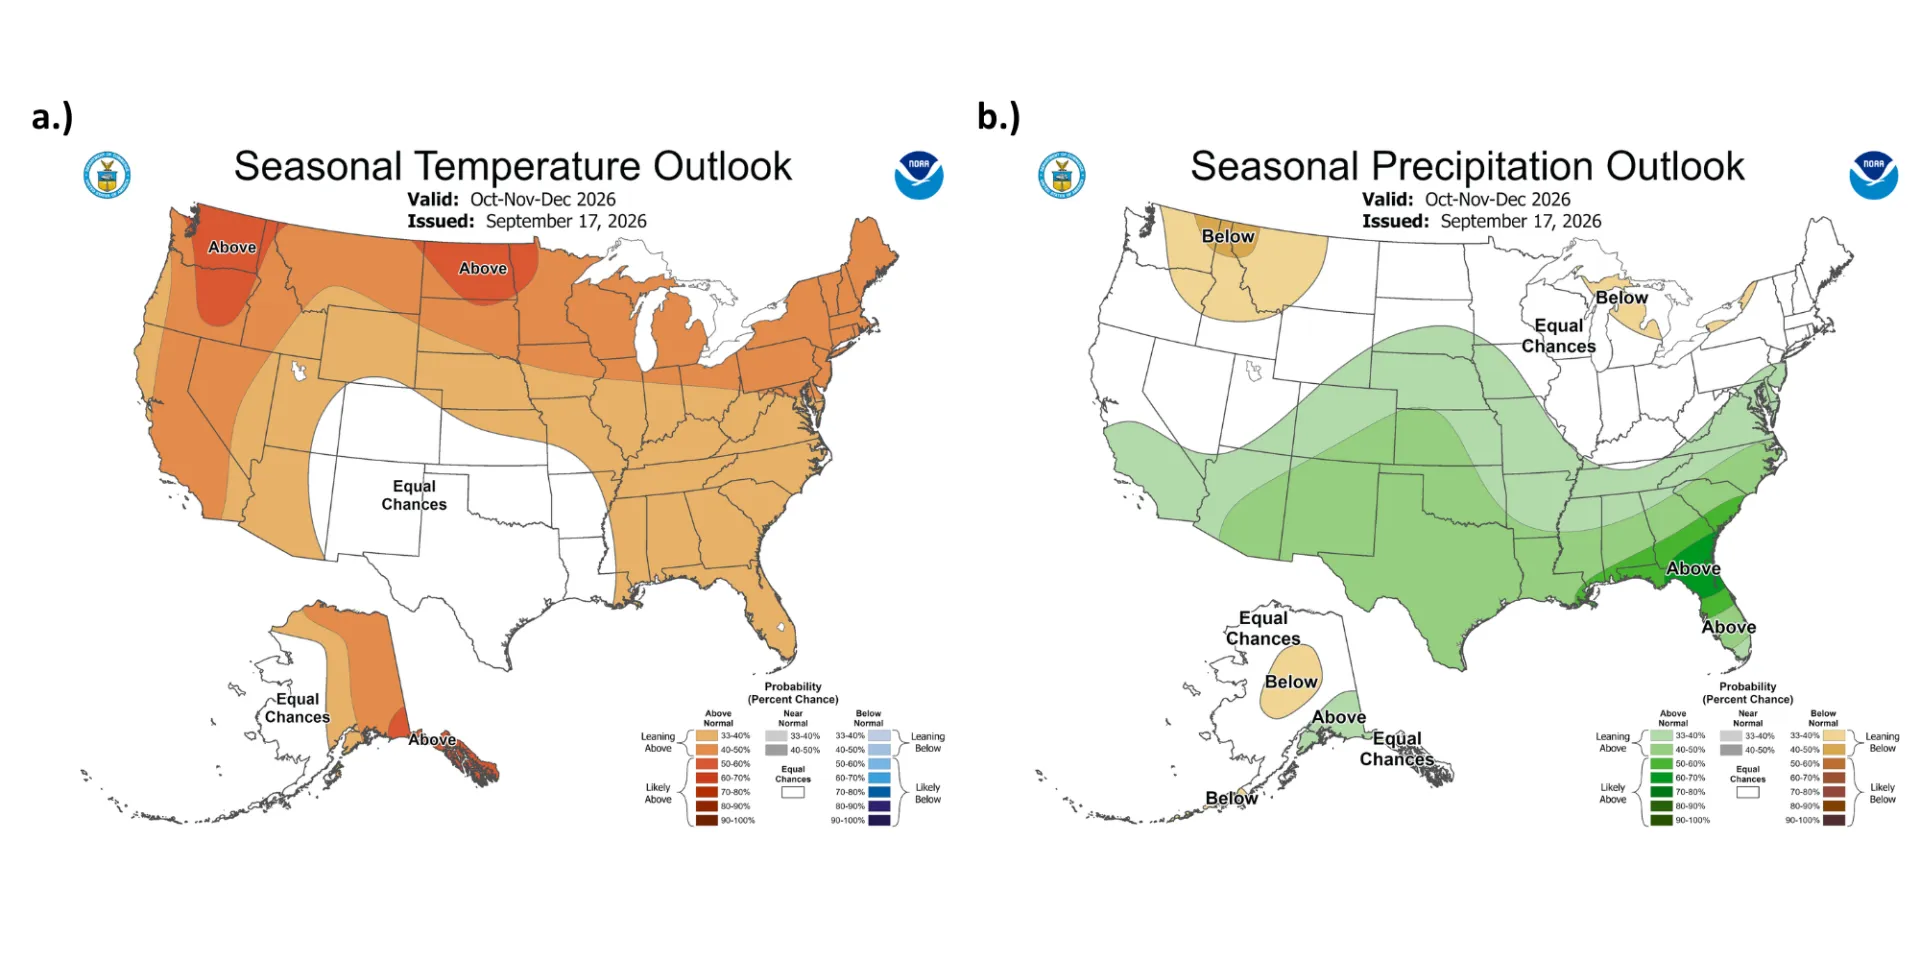
Ohio’s temperature and precipitation outlook for the next three months points to continued above-normal temperatures and an uncertain precipitation signal. The seasonal temperature forecast once again divides the state, with northern Ohio showing a 40–50% probability of above-normal temperatures and southern Ohio leaning slightly lower at 33–40% (Fig. 10a). In contrast, the seasonal precipitation outlook provides no clear indication of wetter- or drier-than-normal conditions, reflecting equal chances across the state (Fig. 10b).
Following several rounds of heavy precipitation over the past month, field conditions across southeastern Ohio generally remain too saturated for heavy machinery to operate safely. While farmers in the southeast wait for soils to dry, northern Ohio has already begun harvesting and progress is well underway. The seasonal precipitation outlook offers no signal on whether sufficiently dry conditions will return to southern Ohio. In the near term, moisture from developing tropical systems in the Atlantic is likely to influence Ohio’s weather this weekend, potentially prolonging wet field conditions in the south.
Authors
Alexis Jahnke: Undergraduate Student, Student Assistant: Climate Services, Byrd Polar and Climate Research Center, The Ohio State University, jahnke.30@osu.edu
Geddy R. Davis: Meteorologist/Atmospheric Scientist, Program Coordinator: Climate Services - Byrd Polar and Climate Research Center, The Ohio State University, davis.5694@osu.edu
Aaron B. Wilson: State Climate Office of Ohio, Byrd Polar and Climate Research Center & OSU Extension, The Ohio State University, wilson.1010@osu.edu