Seasonal Climate Summary: Summer (June - August 2026)
Provided by the State Climate Office of Ohio, a collaboration of the Byrd Polar and Climate Research Center, Geography Department, and OSU Extension with support from Power A Clean Future Ohio.

Temperature and Precipitation
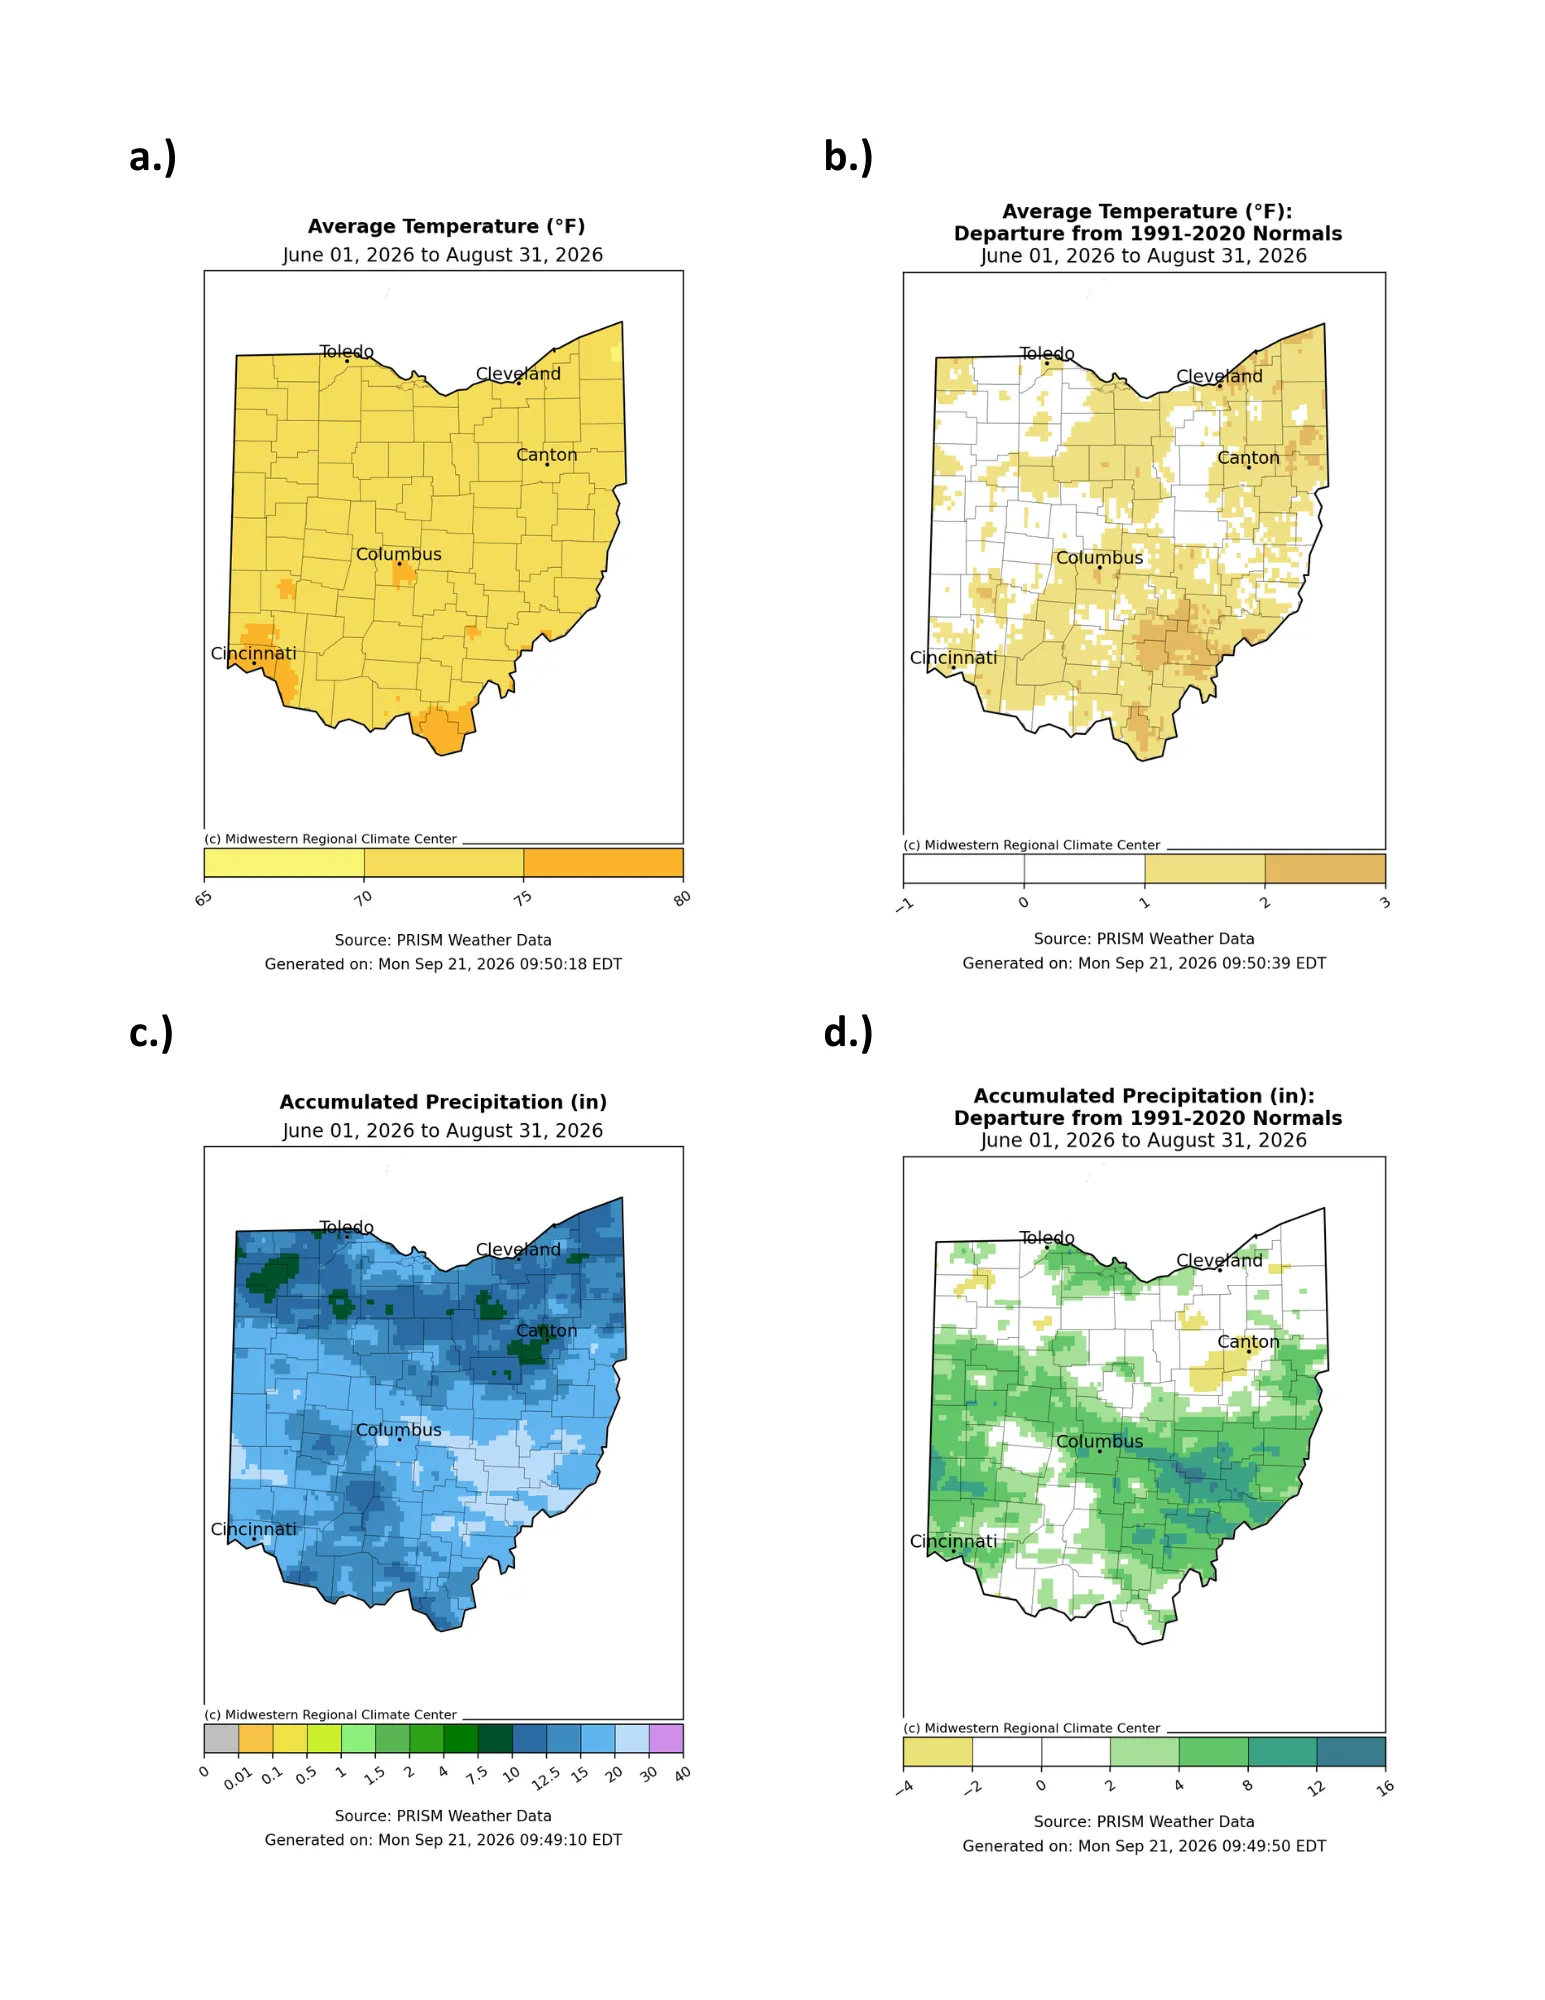
Summer 2026 in Ohio brought typical temperatures paired with noticeably wetter-than-normal conditions. Despite a late June to early July heatwave, statewide average temperatures remained in the 70– 75°F range. Slightly warmer pockets of 75–80°F appeared in the southernmost tip of Ohio, the Cincinnati area, and regions south of Columbus (Fig. 1a). Even so, many of these warmer zones were only 1–2°F above normal. The most pronounced warm anomaly occurred southeast of Columbus, where average temperatures rose 2–3°F above normal (Fig. 1b). Summer precipitation totals ranged widely, from 7.5 to 12.5 inches in northern parts of the state and 15 to 30 inches in southern Ohio. The highest amounts were recorded southeast of Columbus and north of Cincinnati, largely due to late-August storms that prompted significant flooding (Fig. 1c). These heavy rains pushed precipitation departures to 12–16 inches above normal. A few isolated pockets in southwest Canton and parts of northwest Ohio saw 2–4 inches below normal, but these were not substantial enough to produce above D0 drought conditions (Fig. 1d).
Soil and Energy
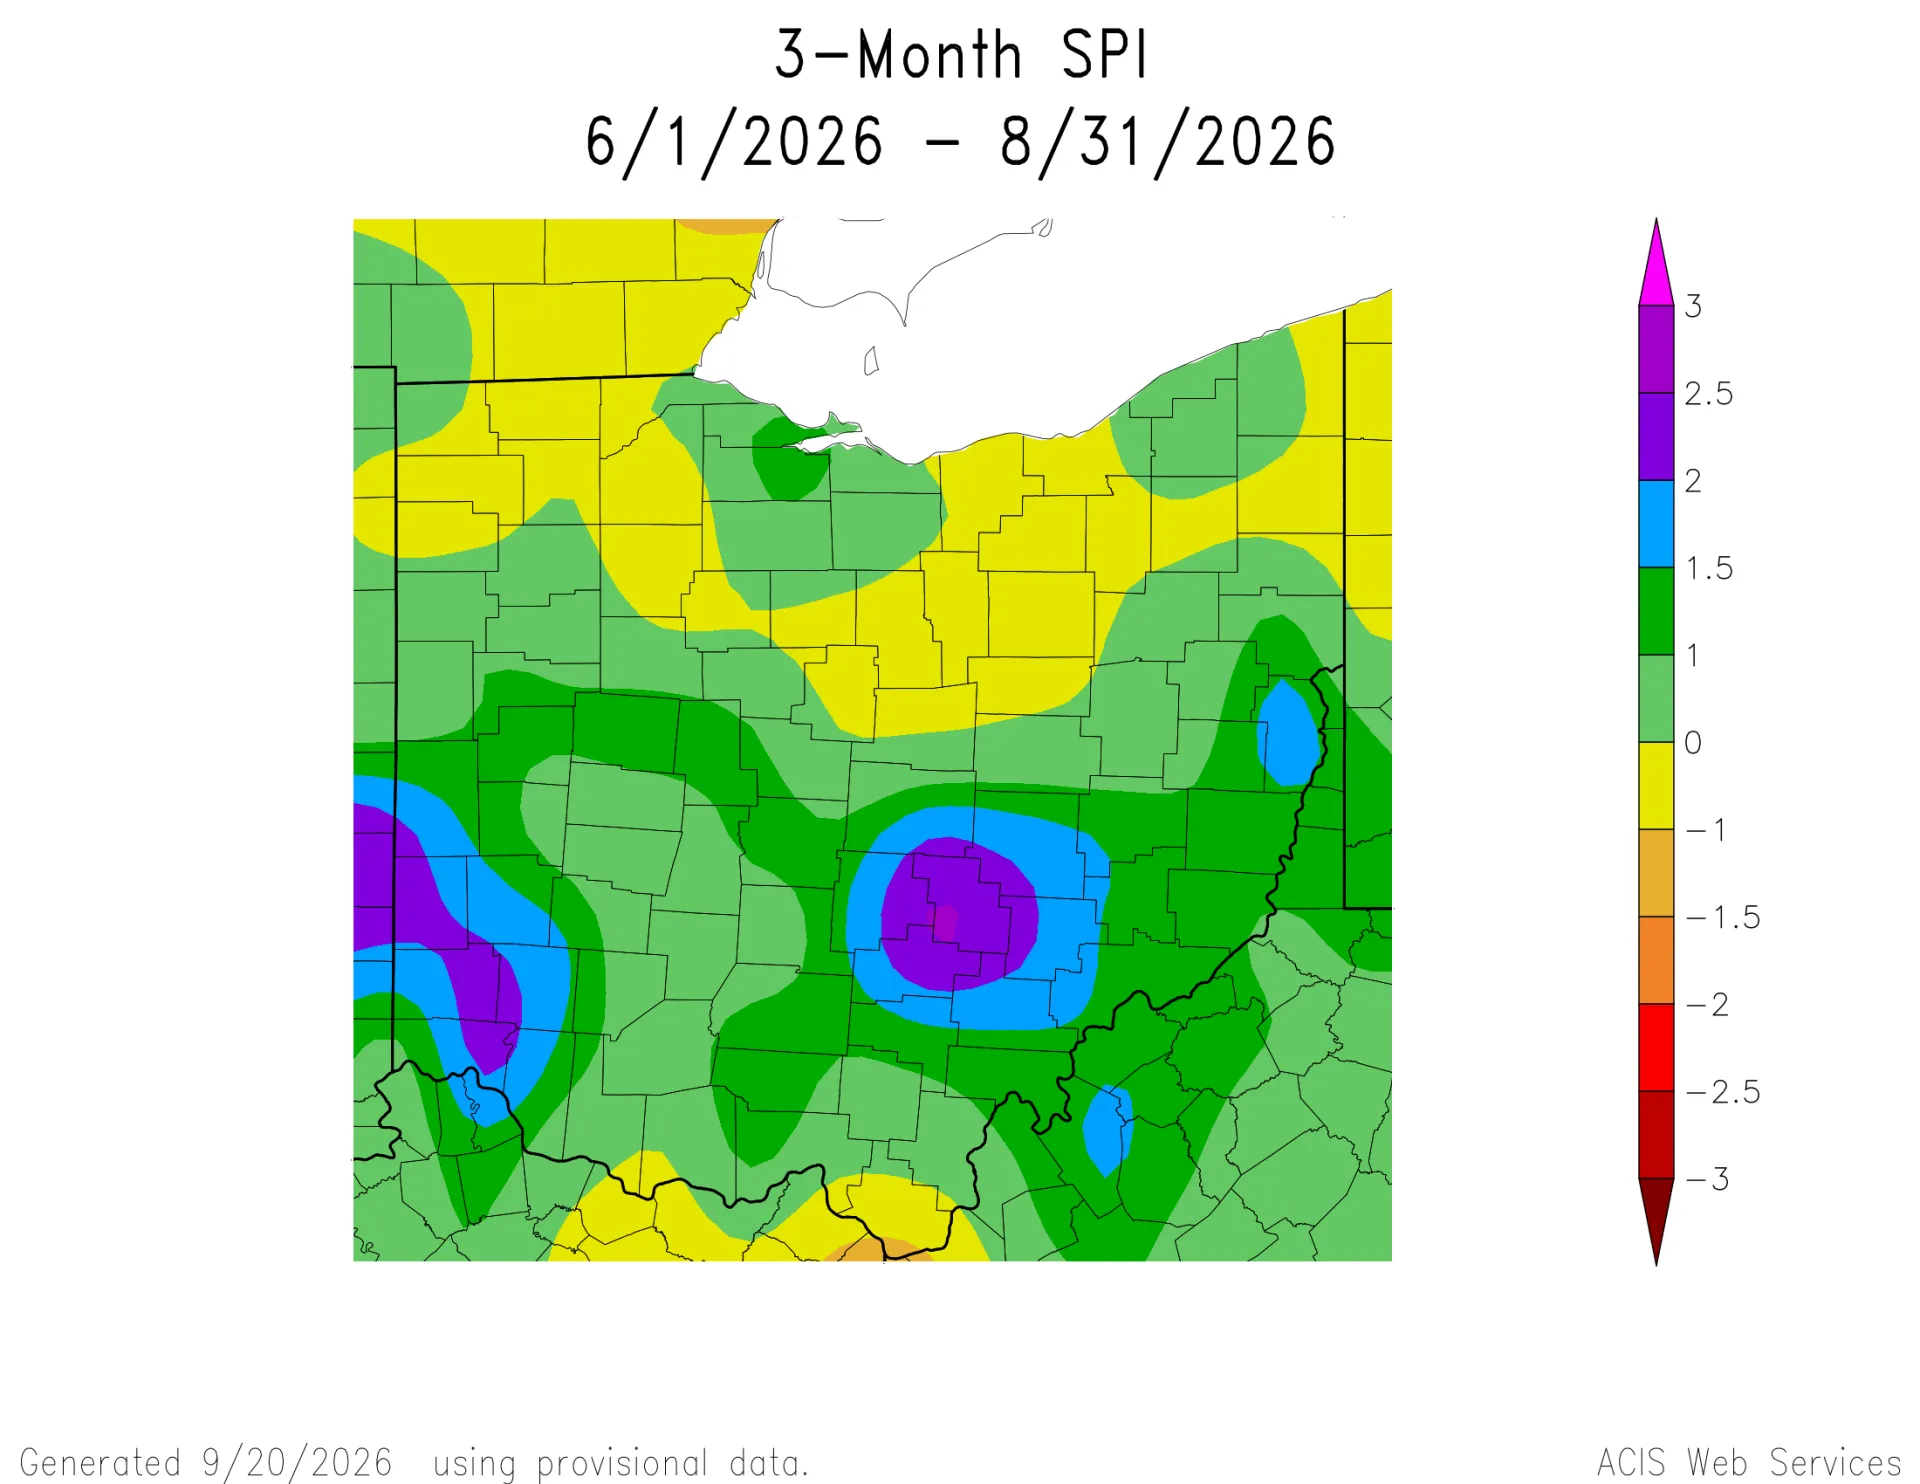
Soil moisture conditions during the summer months supported strong crop growth and limited drought development across Ohio. Both northern Ohio and the state’s southernmost region experienced slightly below-normal moisture, with SPI values ranging from 0 to – 1.5. In contrast, most of Ohio recorded SPI values between 0 and 3. The wettest soils were found south and southeast of Columbus and north of Cincinnati (Fig. 2). Overall, this summer’s rainfall provided favorable growing conditions throughout the season.
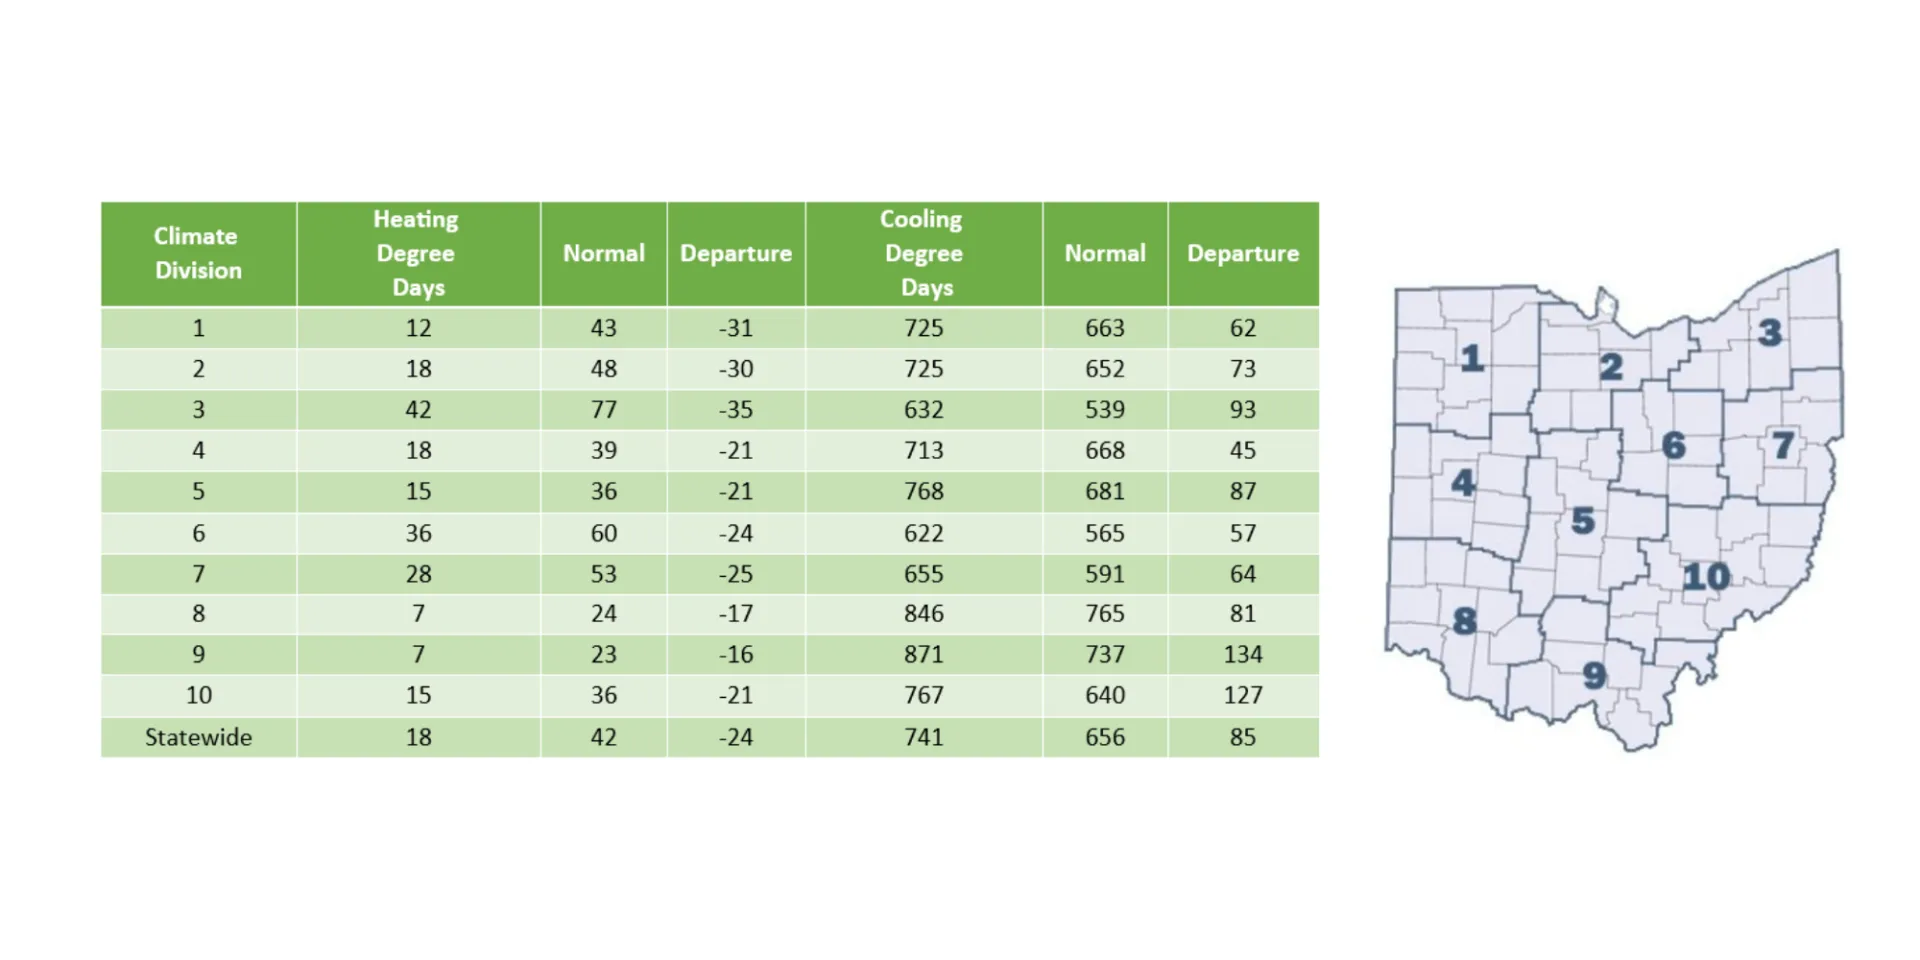
As Heating Degree Days (HDDs) fell below normal, Cooling Degree Days (CDDs) rose well above typical summer values. HDDs averaged 18 statewide, 24 fewer than normal, indicating a reduced demand for heating energy. In contrast, CDDs averaged 741, which is 85 above normal, reflecting increased cooling needs (Fig. 3).
Looking Ahead
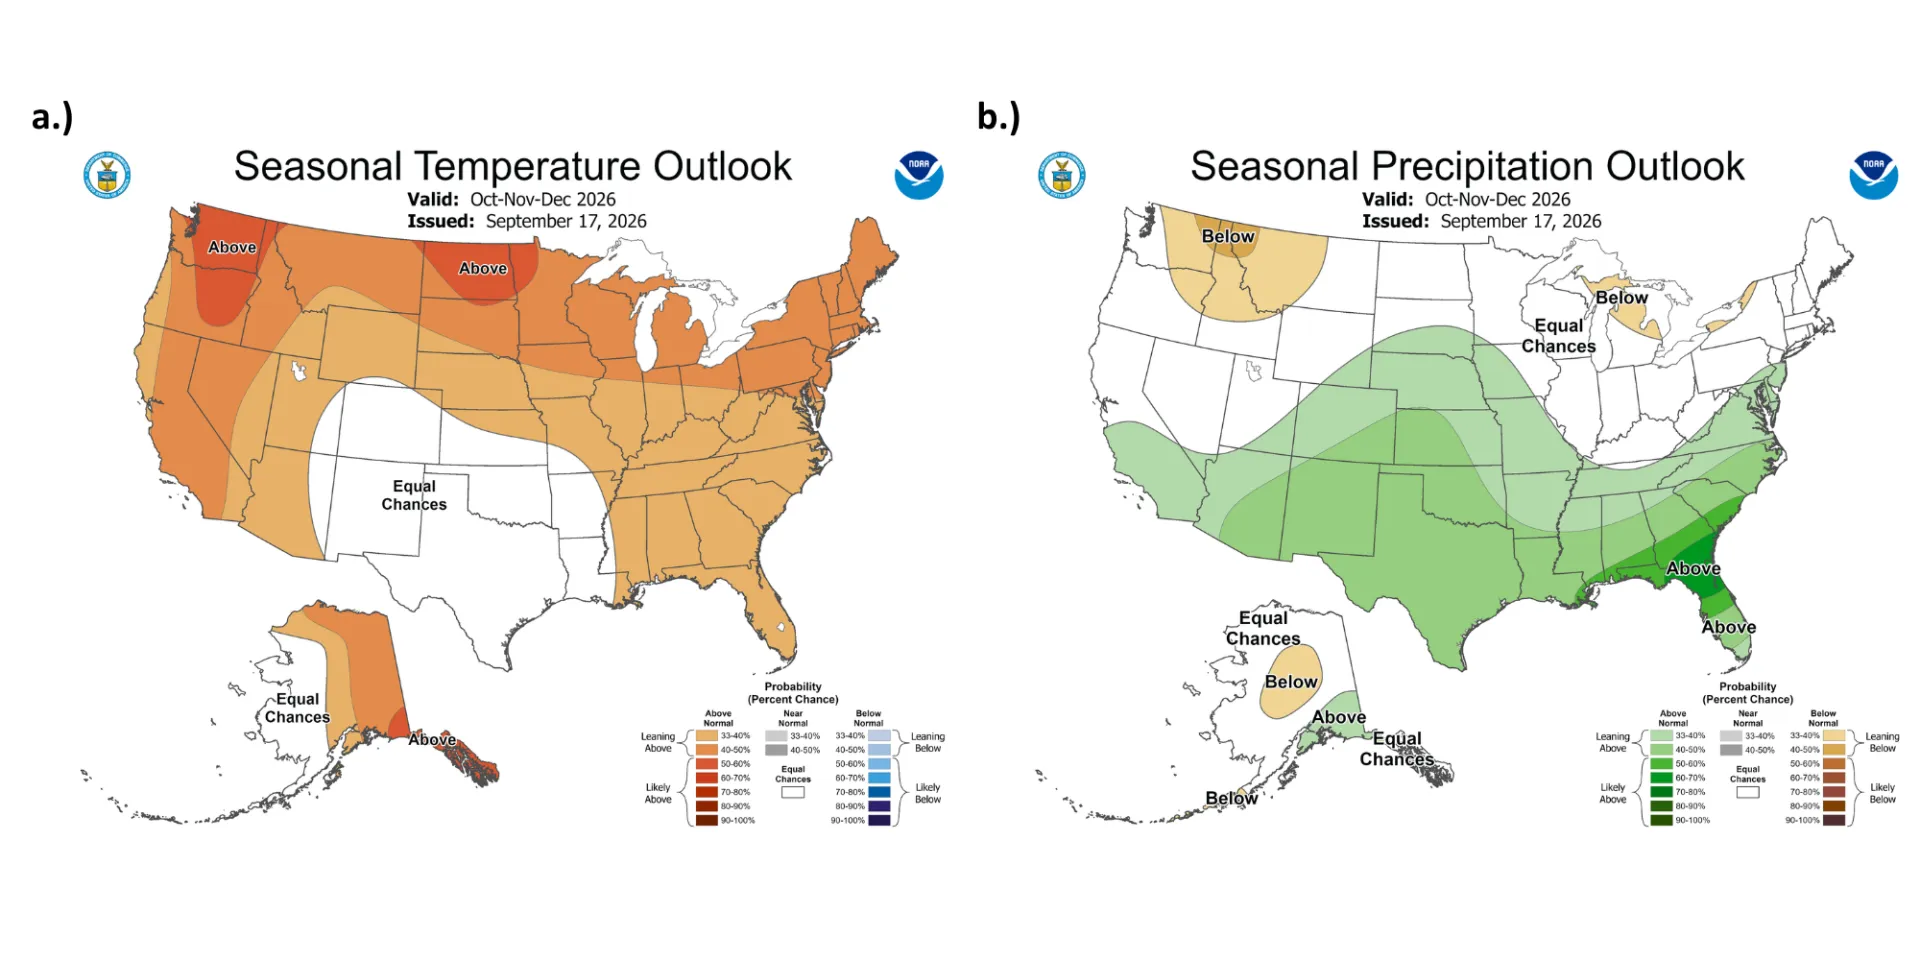
Ohio’s fall outlook suggests a likelihood of above-normal temperatures and an uncertain precipitation signal. Northern Ohio falls within a 40– 50% chance of above-normal temperatures, while southern Ohio’s probability decreases to 30–40% (Fig. 4a). Precipitation forecasts once again show equal chances for above-, near-, or below-normal totals across the state (Fig. 4b).
Unlike last year, Ohio is currently drought-free and has been for the past month, which increases the potential for vibrant fall foliage. Without drought stress, leaves have more time to transition through their full color cycle rather than drying and dropping prematurely, as occurred last year. Recent mid-August rainfall further reduces drought concerns heading into the season. These consistently moist soil conditions have also supported strong agricultural performance. Crop growth has remained above average, and yields are expected to exceed normal levels statewide. Although consistent moisture has generally been beneficial for crops, areas that received the heaviest rainfall have experienced notable field flooding, and poor field conditions may lead to a delayed harvest for some.
Note: these outlooks do not provide the quantity of above- or below-normal conditions, just the likelihood of occurrence (i.e., the probability).
Authors
Alexis Jahnke: Atmospheric Sciences Undergraduate, Student Assistant: Climate Services - Byrd Polar and Climate Research Center, The Ohio State University, jahnke.30@osu.edu
Geddy R. Davis: Meteorologist/Atmospheric Scientist, Program Coordinator: Climate Services - Byrd Polar and Climate Research Center, The Ohio State University, davis.5694@osu.edu
Aaron B. Wilson: State Climate Office of Ohio, Byrd Polar and Climate Research Center & OSU Extension, The Ohio State University, wilson.1010@osu.edu